. 2011 Dec;7(12):e1002457.
doi: 10.1371/journal.ppat.1002457. Epub 2011 Dec 29.

Inflammatory monocytes and neutrophils are licensed to kill during memory responses in vivo

Affiliations

Inflammatory monocytes and neutrophils are licensed to kill during memory responses in vivo

Emilie Narni-Mancinelli et al. PLoS Pathog. 2011 Dec.

Abstract

Immunological memory is a hallmark of B and T lymphocytes that have undergone a previous encounter with a given antigen. It is assumed that memory cells mediate better protection of the host upon re-infection because of improved effector functions such as antibody production, cytotoxic activity and cytokine secretion. In contrast to cells of the adaptive immune system, innate immune cells are believed to exhibit a comparable functional effector response each time the same pathogen is encountered. Here, using mice infected by the intracellular bacterium Listeria monocytogenes, we show that during a recall bacterial infection, the chemokine CCL3 secreted by memory CD8+ T cells drives drastic modifications of the functional properties of several populations of phagocytes. We found that inflammatory ly6C+ monocytes and neutrophils largely mediated memory CD8+ T cell bacteriocidal activity by producing increased levels of reactive oxygen species (ROS), augmenting the pH of their phagosomes and inducing antimicrobial autophagy. These events allowed an extremely rapid control of bacterial growth in vivo and accounted for protective immunity. Therefore, our results provide evidence that cytotoxic memory CD8+ T cells can license distinct antimicrobial effector mechanisms of innate cells to efficiently clear pathogens.


Conflict of interest statement

The authors have declared that no competing interests exist.

Figures

Figure 1
Figure 1. CCL3/ROS+-mediated killing of bacteria is a major mechanism of protection in memory mice.
Wt (black bars) (A–B) and perforin−/− mice (white bars) (A) or p47phox / mice (B) were injected with PBS or immunized with Lm. One month later mice were treated or not with anti-CCL3 serum or anti-IFN-γ mAb and subsequently challenged with 3×10⁵ wt Lm for 2 days. Data show the number of bacteria CFUs (mean±SE) in a pool of two independent experiments with n = 6–9 mice per group.
Figure 2
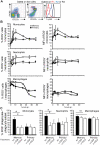
Figure 2. Increased frequencies of ROS+ inflammatory monocytes and neutrophils that generate higher levels of ROS during the secondary infection.
(A) Spleen cells from wt mice (3/group) were independently analyzed by FACS for surface expression of F4/80, CD11b, Ly-6C and Ly-6G. Data show representative FACS profiles in a representative (out of 2) experiment. Red gate: inflammatory Ly6C+ monocytes, black gate: neutrophils, blue gate: macrophages. (B) Mice (9–10 per group) primarily injected with PBS (closed circles, primary) or 0.1xLD50 (3×10³) wt Lm (open circles, secondary) were challenged 30 days later with 10xLD50 (3×10⁵) wt Lm. At the indicated times after challenge, spleen cells were restimulated with Heat Killed Lm (HKLM) in the presence of hydroethidine and analyzed by FACS for CD11b and Ly-6C expression. Data show the number (mean +/− SE) (left panels) and the MFI (mean +/− SE) (right panels) of ROS-producing inflammatory monocytes (upper panel), neutrophils (middle panel) and macrophages (bottom panel) per total gated inflammatory monocytes, neutrophils or macrophages and are representative of a pool of 2–3 replicate experiments. (C) Primary and memory mice (10/group) were treated 30 days later with a control isotype or serum (black bars), anti-CD8 or anti-CCL3 (white bars) and challenged with 3×10⁵ wt Lm. At 10 hrs after the infection, the frequencies of ROS-producing cells were analyzed as in (B). Data result from the pool of 2 independent experiments. P (*<0.05) values were calculated in (B–C) with n = 9–10.
Figure 3
Figure 3. The phagosomal pH inside inflammatory monocytes and neutrophils rises during a secondary immune response.
Primary (black bars) and memory mice (2–3/group) treated or not with anti-CD8 mAb or anti-CCL3 serum (white bars) were challenged with 3×10⁵ wt Lm for 6 hrs. Spleen cells were then incubated with latex beads coupled with pH sensitive and insensitive fluorochromes, stained for surface expression of Ly-6C and CD11b, and analyzed by FACS. Data show the pH values calculated for inflammatory monocytes and neutrophils in one (out of 2) independent experiments.
Figure 4
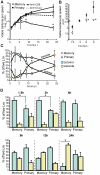
Figure 4. CCL3+ memory CD8+ T cells control bacterial growth during a secondary infection through a vacuolar and a cytosolic mechanism.
(A–B) Primary and memory wt mice (10/group) were treated (A) or not (B) with anti-CD8 or anti-CCL3, and challenged with 3×10⁵ wt Lm. Mice were sacrificed at the indicated times after the infection. (A–B) show the number of bacteria CFUs (mean +/− SE) in the spleen in a pool of 2 replicate experiments. P values were calculated between groups of mice injected with PBS or immunized with wt Lm (n = 10). (C–D) Primary (triangles) and memory mice (rounds) (9–12/group) were challenged one month later with 3×10⁵ wt-L029 Lm. At the indicated times after infection, spleen cells treated or not with chloramphenicol, lysed and plated. (C) Graphs show the frequencies (mean +/− SE) of cytosolic (blue) and vacuolar (yellow) Lm CFUs in phagocytes in a pool of 3–4 experiments (n = 9). (D) is another representation of these data with histograms reporting frequencies (mean +/− SE) of cytosolic (blue bars) and vacuolar (yellow bars) Lm CFUs.
Figure 5
Figure 5. Early killing of Lm requires ROI and takes place inside the vacuoles of phagocytes from secondary infected mice.
Primary and memory mice (9–12/group) were challenged one month later with 3×10⁵ wt-L029 Lm unless otherwise indicated. 1.5 hr post-infection, spleen cells treated or not with chloramphenicol, lysed and plated. (A) shows the number (mean +/− SE) of Lm CFUs recovered from the spleen. In (B), primary and immune mice (4–5/group) were challenged with 2×10⁸ ΔLLO Lm. The number of Lm CFUs (mean +/− SE) per spleen is shown in a pool of 2 experiments. In (C), primary and memory mice (4–6/group) were treated or not with anti-CD8 or anti-CCL3. Histograms show the frequencies (mean +/− SE) of cytosolic (blue bars) and vacuolar (yellow bars) Lm CFUs in phagocytes in a pool of 2 experiments. In (D), primary and memory p47phox −/− and wt C57BL/6 mice (5–6/group) were challenged with 3×10⁵ wt-L029 Lm. Histograms show the frequencies (mean +/− SE) of cytosolic (blue bars) and vacuolar (yellow bars) Lm CFUs in phagocytes in a pool of 2 experiments (n = 5).
Figure 6
Figure 6. Cytosolic bacteria are engulfed and killed via ROI in the vacuoles of phagocytes during a protective secondary response.
In (A), primary and immune mice (4–6/group) were challenged with 3×10⁵ wt- or ΔActA- L029 Lm and spleens were harvested 24 hrs later and treated as described in figure 5. Histograms show the frequencies (mean +/− SE) of cytosolic (blue bars) and vacuolar (yellow bars) Lm CFUs in phagocytes in a pool of 2 experiments. In (B), primary and memory mice (9–12/group) were treated or not with anti-CD8 or anti-CCL3 before challenge with 3×10⁵ wt-L029 Lm. Histograms indicate as in (A) in a pool of 3 experiments (n = 9). In (C), primary and memory p47phox −/− and C57BL/6 wt control mice (5–6/group) were challenged with 3×10⁵ wt-L029 Lm. Data indicate the number (mean +/− SE) of cytosolic and vacuolar Lm CFUs in phagocytes (n = 5).
Figure 7
Figure 7. The reactive oxygen species generated inside inflammatory monocytes and neutrophils from memory mice induce autophagy.
(A) Primary (black bars) and memory mice (white bars) (25/group) were challenged or not with 3×10⁵ wt-L029 Lm. 20 hrs after the infection, spleen cells (from 5 mice/group) were pooled, and flow-sorted inflammatory monocytes, neutrophils and macrophages lysed and each lysate separated on 15% SDS–PAGE and subsequently analyzed with anti-LC3 and anti-actin mAbs (control). (A) Data show representative images (upper) and the quantification histograms (lower) depicting the fold increase of LC3-II/LC3-I ratios (mean +/− SE) measured for each condition and cell subsets compared to the steady state in a pool of 2 to 5 independent experiments. In (B) primary and memory mice (7/group) were challenged with 5×10⁵ wt Lm expressing GFP. 20 hrs later, spleen cells (5 mice/group) were pooled and flow-sorted CD11b+GFP+ infected cells were fixed with glutaraldehyde, and analyzed by electron microscopy. Representative EM images of autophagosomes formation exhibiting double membranes around the bacteria are shown.

Similar articles

Cited by

References

    1. Harty JT, Tvinnereim AR, White DW. CD8+ T cell effector mechanisms in resistance to infection. Annu Rev Immunol. 2000;18:275–308. - PubMed
    1. Masopust D, Vezys V, Marzo AL, Lefrancois L. Preferential localization of effector memory cells in nonlymphoid tissue. Science. 2001;291:2413–2417. - PubMed
    1. Guidotti LG, Chisari FV. Noncytolytic control of viral infections by the innate and adaptive immune response. Annu Rev Immunol. 2001;19:65–91. - PubMed
    1. Cowley SC, Sedgwick JD, Elkins KL. Differential requirements by CD4+ and CD8+ T cells for soluble and membrane TNF in control of Francisella tularensis live vaccine strain intramacrophage growth. J Immunol. 2007;179:7709–7719. - PubMed
    1. Muller I, Kropf P, Etges RJ, Louis JA. Gamma interferon response in secondary Leishmania major infection: role of CD8+ T cells. Infect Immun. 1993;61:3730–3738. - PMC - PubMed

Publication types