. 2011 Dec;7(12):e1002429.
doi: 10.1371/journal.pgen.1002429. Epub 2011 Dec 29.

MAPK/ERK signaling regulates insulin sensitivity to control glucose metabolism in Drosophila

Affiliations

MAPK/ERK signaling regulates insulin sensitivity to control glucose metabolism in Drosophila

Wei Zhang et al. PLoS Genet. 2011 Dec.

Abstract

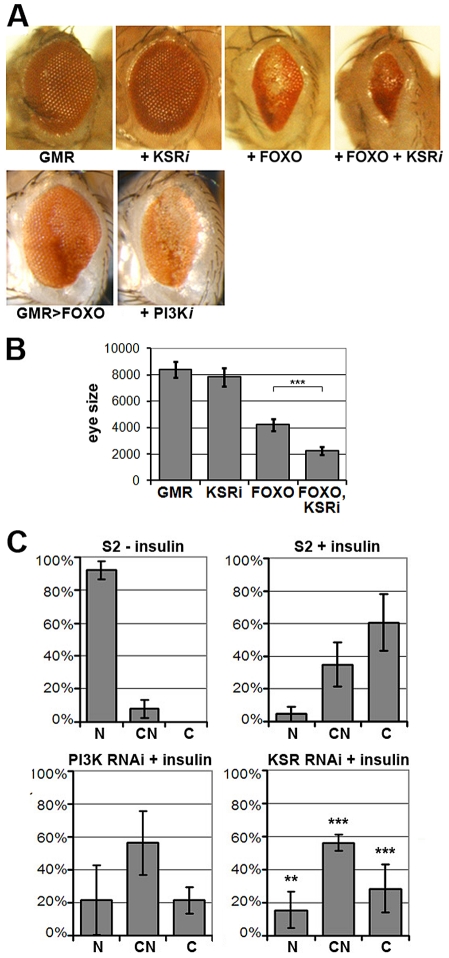
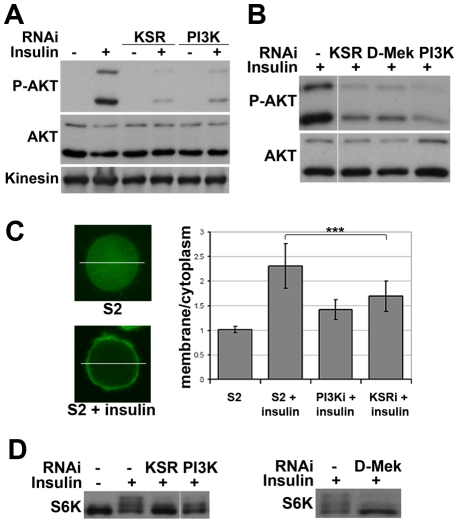
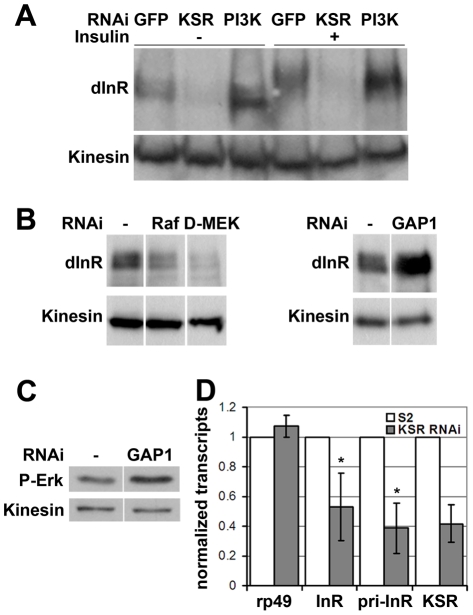
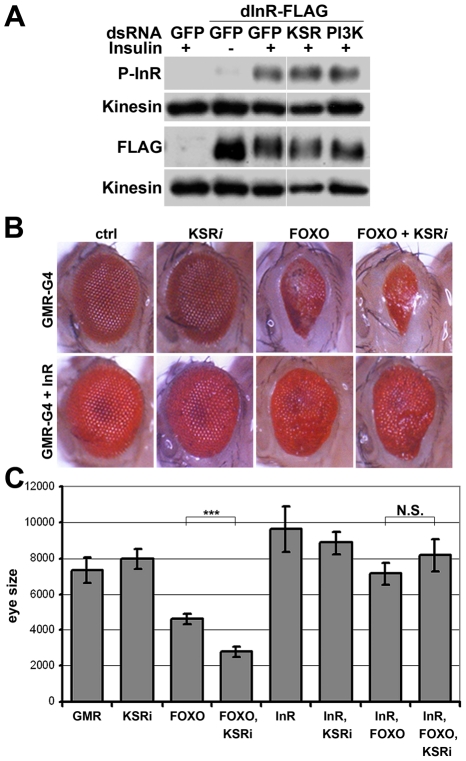
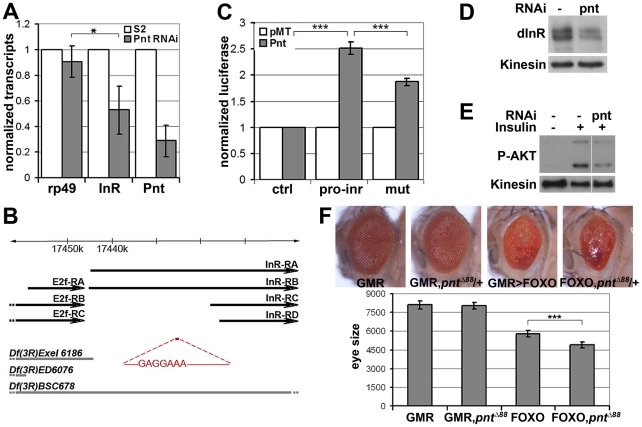
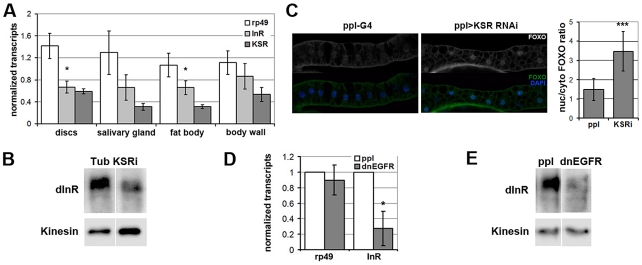
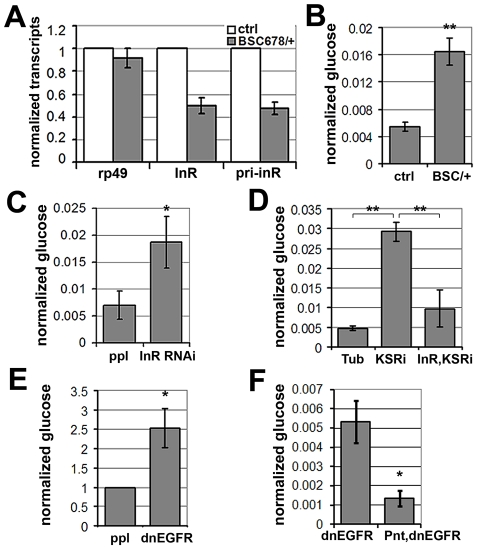
The insulin/IGF-activated AKT signaling pathway plays a crucial role in regulating tissue growth and metabolism in multicellular animals. Although core components of the pathway are well defined, less is known about mechanisms that adjust the sensitivity of the pathway to extracellular stimuli. In humans, disturbance in insulin sensitivity leads to impaired clearance of glucose from the blood stream, which is a hallmark of diabetes. Here we present the results of a genetic screen in Drosophila designed to identify regulators of insulin sensitivity in vivo. Components of the MAPK/ERK pathway were identified as modifiers of cellular insulin responsiveness. Insulin resistance was due to downregulation of insulin-like receptor gene expression following persistent MAPK/ERK inhibition. The MAPK/ERK pathway acts via the ETS-1 transcription factor Pointed. This mechanism permits physiological adjustment of insulin sensitivity and subsequent maintenance of circulating glucose at appropriate levels.


Conflict of interest statement

The authors have declared that no competing interests exist.

Figures

Figure 1
Figure 1. KSR is involved in the regulation of FOXO activity.
(A) Photomicrographs of adult eyes. Upper panel: UAS-KSRRNAi or UAS-FOXO or both were expressed in the developing eye with the GMR-GAL4 driver. Lower panels: GMR-GAL4+UAS-FOXO also expressing UAS-RNAi to deplete PI3K. (B) Quantification of the total area of affected eyes of the indicated genotypes measured in pixels from digital images using ImageJ. Error bars indicate standard deviation from measurement of at least 6 eyes for each genotype. Student's t-test: (***) p<0.001. (C) Quantification of the subcellular localization of transfected FOXO-GFP. S2 cells with GFP signal were classified into 3 groups according to FOXO localization (N: predominantly nuclear; CN: equal levels in cytoplasm and nucleus; C: predominantly cytoplasmic). Upper panels: compare unstimulated cells with cells stimulated with insulin (10 µg/ml, 30 min). Lower panels: Cells transfected with dsRNA to deplete PI3K or KSR and after 4 days, stimulated with insulin. Error bars represent standard deviation from 3 independent experiments. Fisher's exact test was used to assess the difference between insulin-stimulated S2 cells with and without KSR depletion: (**) p<0.01; (***) p<0.001.
Figure 2
Figure 2. Impaired insulin signaling activation upon MAPK/ERK inhibition.
(A) Immunoblots to detect AKT phosphorylation. Cells were treated with dsRNA to deplete KSR or PI3K and stimulated with insulin (10 µg/ml, 30 min; “+”) or left untreated (“−”). AKT phosphorylation was detected by an antibody specific for the phosphorylated form of the AKT ‘hydrophobic motif’ site S505. Antibody to total AKT protein and Kinesin were used as loading controls. (B) Immunoblots to visualize the level of AKT S505 phosphorylation and total AKT in cells treated with dsRNA to deplete KSR, D-MEK or PI3K. Cells were stimulated with insulin (30 min). Samples were run on the same gel, but intervening lanes have been removed as indicated. (C) Visualization of the level of PIP3 in the cell membrane by localization of a GFP-GRP1 PH domain fusion protein. Left panel: photomicrographs showing translocation of GFP-GRP1 PH to the membrane upon insulin stimulation. The ratio of membrane to cytoplasmic GFP levels was measured as pixel intensity along the white line. Right panel: histogram showing the ratio of membrane to cytoplasmic GFP levels. PI3K and KSR depleted cells showed less PH domain membrane localization upon insulin stimulation. Student's t-test: (***) p<0.001. (D) Immunoblots to visualize the level of S6K phosphorylation in cells treated with dsRNA to deplete KSR, PI3K or D-MEK. Cells were stimulated with insulin (10 µg/ml, 30 min). The slower migrating forms correspond to phosphorylated S6K. Left panel: samples were run on the same gel, but intervening lanes have been removed as indicated.
Figure 3
Figure 3. MAPK/ERK signaling regulates inr gene expression.
(A) Immunoblot to visualize the level of InR protein. Cells were treated with dsRNA to deplete PI3K, KSR or GFP as a control and after 5 days stimulated with insulin. In control cells, insulin stimulation results in a phosphorylation-induced mobility shift in SDS-PAGE. Anti-Kinesin was used as loading control. (B) Immunoblots to visualize the level of InR protein in cells treated with dsRNA to deplete Raf, D-MEK or GAP1. Samples were run on the same gel, but intervening lanes have been removed as indicated. (C) Immunoblot to visualize the MAPK/ERK activity using an antibody specific to the phosphorylated form of ERK. S2 cells were treated with dsRNA to deplete GAP1 or left untreated. Anti-Kinesin was used as a loading control. Samples were run on the same gel, but intervening lanes have been removed as indicated. (D) Histogram showing the levels of rp49, inr and ksr mRNAs measured by quantitative RT-PCR. S2 cells were treated with dsRNA to deplete ksr (gray bars) or left untreated (white bars). Total RNA were extracted and normalized for cDNA synthesis. RNA levels were normalized to kinesin mRNA. The efficiency of ksr depletion was ∼60%. inr denotes the mature mRNA; pri-inr denotes the unspliced nuclear primary transcript measured using intron-specific primers. Error bars represent standard deviation from 3 independent experiments. Student's t-test: (*) p<0.05.
Figure 4
Figure 4. InR transgene expressed under heterologous promoter is insensitive to KSR depletion.
(A) Immunoblots to visualize the level of Flag-tagged InR protein expressed under control of the pMT promoter in transfected S2 cells. Cells were treated with dsRNA to deplete PI3K, KSR or GFP as a control and after 5 days stimulated with insulin. Insulin activity was visualized using antibody specific to the phosphorylated form of InR (upper panel). Total Flag-InR was visualized with anti-Flag. Anti-Kinesin was used as loading control. Samples were run on the same gel, but intervening lanes have been removed as indicated. (B) Adult eyes expressing GMR-Gal4 and UAS-FOXO, UAS-InR and/or a UAS-ksrRNAi transgene to deplete KSR. (C) Quantification of the total eye area measured in pixels from digital images using ImageJ. Error bars indicate standard deviation from measurement of at least 5 eyes for each genotype. Student's t-test: (***) p<0.001. (N.S.) indicates that there was no significant effect of KSR depletion in the UAS-FOXO+UAS-InR eyes.
Figure 5
Figure 5. inr is regulated by the ETS-1 transcription factor Pointed.
(A) Measurement of inr transcript levels in S2 cells transfected with dsRNA to deplete pointed mRNA or left untreated. The efficiency of pointed depletion was ∼70%. inr was reduced to ∼50% compared to rp49 after normalization to kinesin mRNA. Error bars represent standard deviation based on 4 independent experiments. Student's t-test: (*) p<0.05. (B) Schematic representation of the inr locus. Thick black arrow lines indicate transcripts of inr and E2F. The cis-regulatory region identified by luciferase assay is shown in red and the Pnt consensus site sequence is indicated. Thick gray lines represent deletions used in Figure 7 as well as Figures S7 and S8. Note that the deletions affect multiple genes. Only inr and adjacent E2F loci are indicated. (C) Luciferase assays showing activation of the reporter plasmids after cotransfection with a vector to express Pnt-P2 (gray bars) or empty vector as a control (white bars). pro-inr denotes luciferase reporter with the DNA element from the inr cis control region shown in (B). mut denotes luciferase reporter with the Pnt consensus site mutated. pGL3-Basic was used as the control reporter. Error bars represent standard deviation based on 4 independent experiments. Student's t-test: (***) p<0.001. (D) Immunoblot to visualize the level of InR protein in S2 cells treated with dsRNA to deplete pointed or left untreated. Anti-Kinesin was used as a loading control. (E) Immunoblot to visualize the level of AKT S505 phosphorylation in S2 cells treated with dsRNA to deplete pointed. After 5 days cells were stimulated with insulin (30 min). (F) Upper panel: Photographs of adult eyes. From left to right: GMR-Gal4 alone; GMR-Gal4 with one mutant copy of the pointed gene (pntΔ88 allele); GMR-Gal4+UAS-FOXO; GMR-Gal4+UAS-FOXO with one mutant copy of the pointed gene (pntΔ88 allele). Lower panel: Plot of total eye area measured in pixels from digital images using ImageJ. Error bars indicate standard deviation from measurement of at least 5 eyes for each genotype. Student's t-test: (***) p<0.001.
Figure 6
Figure 6. EGFR-MAPK/ERK signaling regulates InR expression and FOXO localization in vivo.
(A) Histogram showing the levels of rp49, inr and ksr mRNAs measured by quantitative RT-PCR. Wandering 3rd instar larvae expressed UAS-ksrRNAi under ubiquitous tubulin-Gal4 control. Controls expressed tubulin-Gal4 without the UAS-RNAi transgene. Total RNA was isolated from imaginal discs, fat body, salivary gland and body wall. RNA levels were normalized for cDNA synthesis before Q-PCR. RNA levels were normalized to kinesin mRNA. The efficiency of KSR depletion is shown in dark gray bars. Student's t-test: (*) p<0.05. (B) Immunoblot to detect the level of InR protein in fat body from wandering 3rd instar larvae expressed UAS-KSRRNAi under Tubulin-Gal4 control. Samples were run on the same gel, but intervening lanes have been removed as indicated. (C) Left panels: Immunofluorescent images of fat body dissected from wandering 3rd instar larvae stained with anti-FOXO (green). Nuclei were labeled with DAPI (Blue). Larvae expressed UAS-ksrRNAi under pumpless-Gal4 control. Control larvae expressed Gal4 without the RNAi transgene. Right panel: Quantification of the ratio between nuclear FOXO and cytoplasmic FOXO in fat body expressing ppl-Gal4 or with UAS-ksrRNAi. Subcellular regions were defined by DAPI staining. FOXO intensities were measured in pixels from digital images using ImageJ. Error bars represent standard deviation from measurement of at least 24 cells for each genotype. Student's t-test: (***) p<0.001. (D) Histogram showing the levels of rp49 and inr mRNAs measured by quantitative RT-PCR. Wandering 3rd instar larvae expressed UAS-dnEGFR under pumpless-Gal4 control. Controls expressed Gal4 without the UAS transgene. Total RNA was isolated from the fat body. RNA levels were normalized to kinesin mRNA. Error bars represent standard deviation from 3 independent experiments. Student's t-test: (*) p<0.05. (E) Immunoblot to visualize the level of InR protein in fat body from wandering 3rd instar larvae expressing UAS-dnEGFR under pumpless-Gal4 control. Samples were run on the same gel, but intervening lanes have been removed as indicated.
Figure 7
Figure 7. MAPK/ERK regulates inr expression to control circulating glucose levels.
(A) Histogram showing the levels of rp49, inr mRNAs and inr primary transcript (pri-inr) measured by quantitative RT-PCR in control (y, w) and Df(3R)BSC678/+ larvae. Error bars represent standard deviation from 3 independent experiments. (B) Histogram showing glucose levels in control (y, w) and Df(3R)BSC678/+ larval hemolymph. Error bars represent standard deviation from 3 independent experiments. Student's t-test: (**) p<0.01. (C) Histogram showing glucose levels in hemolymph from larvae expressing UAS-InRRNAi under pumpless-Gal4 control. Error bars represent standard deviation from 3 independent experiments. Student's t-test: (*) p<0.05. (D) Histogram showing the levels of circulating glucose in hemolymph. Wandering 3rd instar larvae expressed UAS-KSRRNAi under Tubulin-Gal4 with or without co-expressed UAS-inr. Controls expressed Gal4 without the RNAi transgenes. Student's t-test: (**) p<0.01. (E) Histogram showing glucose levels in hemolymph from larvae expressing UAS-dnEGFR under pumpless-Gal4 control. Error bars represent standard deviation from 3 independent experiments. Student's t-test: (*) p<0.05. (F) Histogram showing the levels of circulating glucose from larvae expressing UAS-dnEGFR without or with overexpression of Pointed under pumpless-Gal4 control. Error bars represent standard deviation from 3 independent experiments. Student's t-test: (*) p<0.05.

Similar articles

Cited by

References

    1. Manning BD, Cantley LC. AKT/PKB signaling: navigating downstream. Cell. 2007;129:1261–1274. - PMC - PubMed
    1. Hietakangas V, Cohen SM. Regulation of tissue growth through nutrient sensing. Annu Rev Genet. 2009;43:389–410. - PubMed
    1. Engelman JA, Luo J, Cantley LC. The evolution of phosphatidylinositol 3-kinases as regulators of growth and metabolism. Nat Rev Genet. 2006;7:606–619. - PubMed
    1. Sarbassov DD, Guertin DA, Ali SM, Sabatini DM. Phosphorylation and regulation of Akt/PKB by the rictor-mTOR complex. Science. 2005;307:1098–1101. - PubMed
    1. Hresko RC, Mueckler M. mTOR.RICTOR is the Ser473 kinase for Akt/protein kinase B in 3T3-L1 adipocytes. J Biol Chem. 2005;280:40406–40416. - PubMed

Publication types

MeSH terms