. 2011 Dec;7(12):e1002439.
doi: 10.1371/journal.pgen.1002439. Epub 2011 Dec 29.

Common variants show predicted polygenic effects on height in the tails of the distribution, except in extremely short individuals

Affiliations

Common variants show predicted polygenic effects on height in the tails of the distribution, except in extremely short individuals

Yingleong Chan et al. PLoS Genet. 2011 Dec.

Abstract

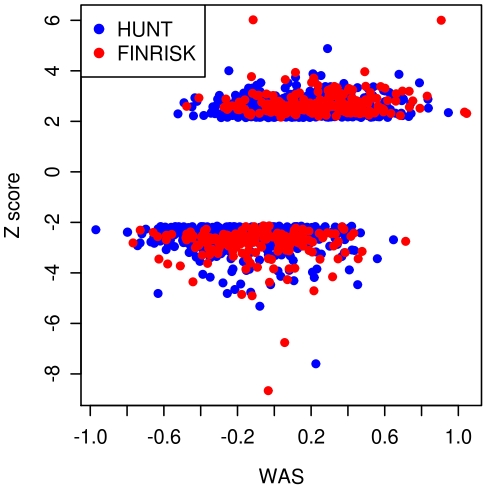
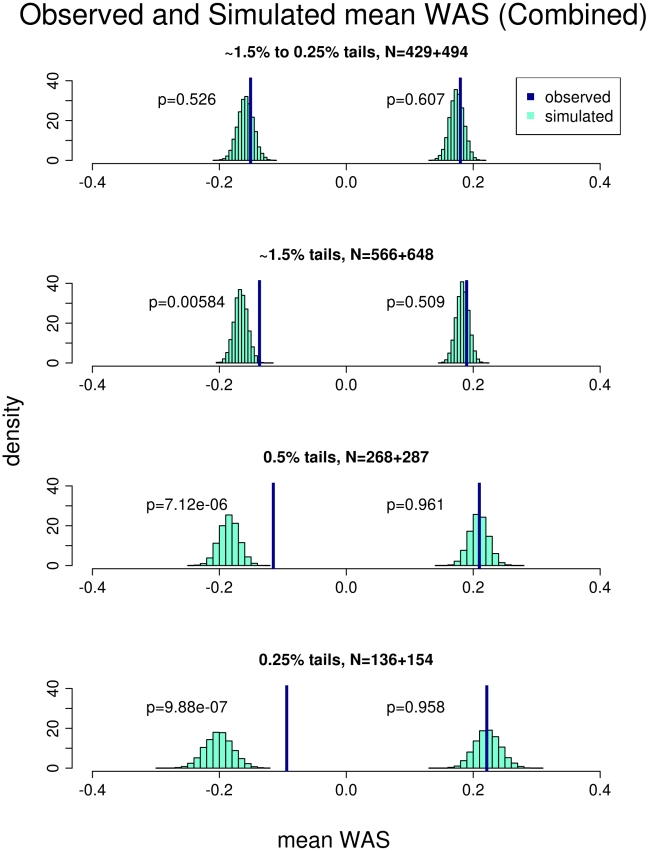
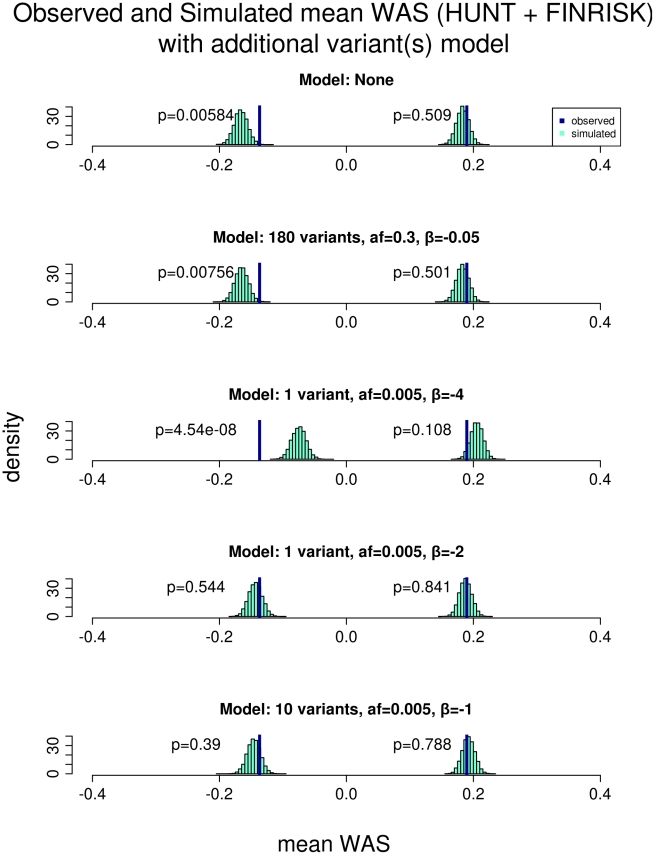
Common genetic variants have been shown to explain a fraction of the inherited variation for many common diseases and quantitative traits, including height, a classic polygenic trait. The extent to which common variation determines the phenotype of highly heritable traits such as height is uncertain, as is the extent to which common variation is relevant to individuals with more extreme phenotypes. To address these questions, we studied 1,214 individuals from the top and bottom extremes of the height distribution (tallest and shortest ∼1.5%), drawn from ∼78,000 individuals from the HUNT and FINRISK cohorts. We found that common variants still influence height at the extremes of the distribution: common variants (49/141) were nominally associated with height in the expected direction more often than is expected by chance (p<5×10⁻²⁸), and the odds ratios in the extreme samples were consistent with the effects estimated previously in population-based data. To examine more closely whether the common variants have the expected effects, we calculated a weighted allele score (WAS), which is a weighted prediction of height for each individual based on the previously estimated effect sizes of the common variants in the overall population. The average WAS is consistent with expectation in the tall individuals, but was not as extreme as expected in the shortest individuals (p<0.006), indicating that some of the short stature is explained by factors other than common genetic variation. The discrepancy was more pronounced (p<10⁻⁶) in the most extreme individuals (height<0.25 percentile). The results at the extreme short tails are consistent with a large number of models incorporating either rare genetic non-additive or rare non-genetic factors that decrease height. We conclude that common genetic variants are associated with height at the extremes as well as across the population, but that additional factors become more prominent at the shorter extreme.


Conflict of interest statement

The authors have declared that no competing interests exist.

Figures

Figure 1
Figure 1. Plot of weighted allele scores (WAS) against Height Z-scores for HUNT and FINRISK cohorts.
The plot shows the WAS, a measure of the genetic prediction of height by known common variants, against the height Z-scores. The tall individuals (Z-score>2.14) have generally larger WAS than the short individuals (Z-score<−2.14). Individuals from the HUNT study are labeled blue and individuals from the FINRISK study are labeled red.
Figure 2
Figure 2. Comparison of the observed versus simulated mean weighted allele score (WAS) in the combined cohort.
The plot shows the result of comparing the mean WAS of the short and tall individuals observed from both the HUNT and FINRISK cohorts against that obtained from simulation. Each row represents a different stratification of the extremes. The percentiles and number of individuals in the short and tall extreme respectively are listed for each stratum. The p-values represent the comparison between the observed and simulated mean WAS. The observed mean WAS for the tall individuals are not different from the simulation in any of the strata. The observed mean WAS for the short individuals is not different from the simulation in the first stratum. As a progressively more extreme sample is used, the short individuals' mean WAS becomes progressively more significantly different than the simulation.
Figure 3
Figure 3. Comparison of the observed versus simulated mean WAS with models incorporating additional variants.
The plot shows the result of comparing the mean WAS of the short and tall individuals observed from both the HUNT and FINRISK cohorts against that obtained from simulation with different scenarios of additional variants. All rows use the approximate 1.5% tails of the height distribution as extremes, resulting in 566 short and 648 tall individuals. The 1st row shows the result where the model has no additional variants affecting height and thus is identical to that from the 2nd row of Figure 2. The 2nd row shows a model where there are 180 additional common variants that slightly decreases height (allele frequency = 0.3 and effect size (β) = −0.05). This model does not result in any significant change to the simulated WAS of the short individuals and the observed WAS is still significantly different (p = 0.00756). The 3rd row shows a model where there is 1 additional low frequency variant with a large height decreasing effect (allele frequency = 0.005 and effect size (β) = −4). This model results in a large shift in the simulated WAS of the short individuals to the right. The observed WAS is still significantly different (p = 4.54×10⁻⁸) than the simulation but in the opposite direction and thus is not consistent with our data. The 4th row shows a model where there is 1 additional low frequency variant that decreases height significantly (allele frequency = 0.005 and effect size (β) = −2). This model results in a shift in the simulated WAS of the short individuals to the right such that the observed WAS is no longer different from the simulation (p = 0.544). The 5th row shows a model where there are 10 additional low frequency variants that moderately decreases height (allele frequency = 0.005 and effect size (β) = −1). This model also results in a shift in the simulated WAS of the short individuals to the right such that the observed WAS is no longer different from the simulation (p = 0.39). The final two models are consistent with our observed data.

References

    1. Visscher PM, Macgregor S, Benyamin B, Zhu G, Gordon S, et al. Genome partitioning of genetic variation for height from 11,214 sibling pairs. Am J Hum Genet. 2007;81:1104–1110. - PMC - PubMed
    1. Lango Allen H, Estrada K, Lettre G, Berndt SI, Weedon MN, et al. Hundreds of variants clustered in genomic loci and biological pathways affect human height. Nature 2010 - PMC - PubMed
    1. Eichler EE, Flint J, Gibson G, Kong A, Leal SM, et al. Missing heritability and strategies for finding the underlying causes of complex disease. Nat Rev Genet. 2010;11:446–450. - PMC - PubMed
    1. Cirulli ET, Goldstein DB. Uncovering the roles of rare variants in common disease through whole-genome sequencing. Nat Rev Genet. 2010;11:415–425. - PubMed
    1. Manolio TA, Collins FS, Cox NJ, Goldstein DB, Hindorff LA, et al. Finding the missing heritability of complex diseases. Nature. 2009;461:747–753. - PMC - PubMed

Publication types