. 2012 Jan;8(1):e1002419.
doi: 10.1371/journal.pgen.1002419. Epub 2012 Jan 5.

Functional specialization of the plant miR396 regulatory network through distinct microRNA-target interactions

Affiliations

Functional specialization of the plant miR396 regulatory network through distinct microRNA-target interactions

Juan M Debernardi et al. PLoS Genet. 2012 Jan.

Abstract

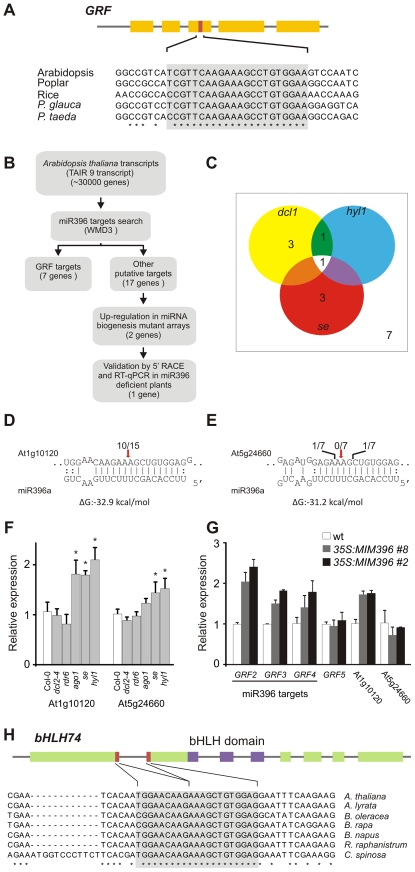
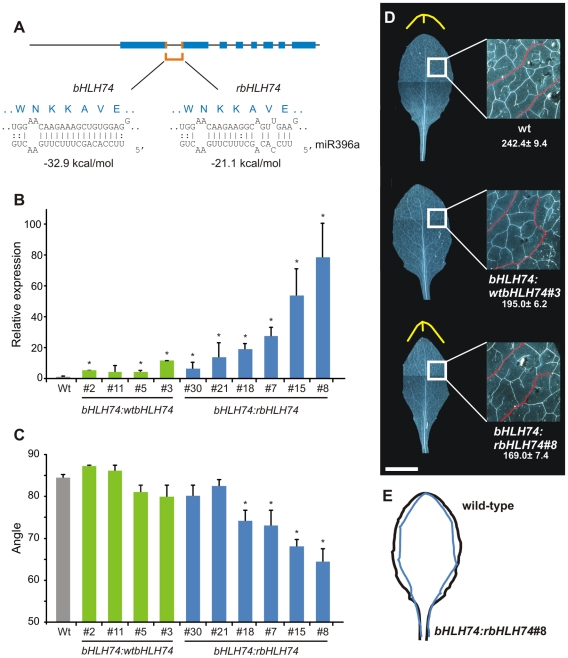
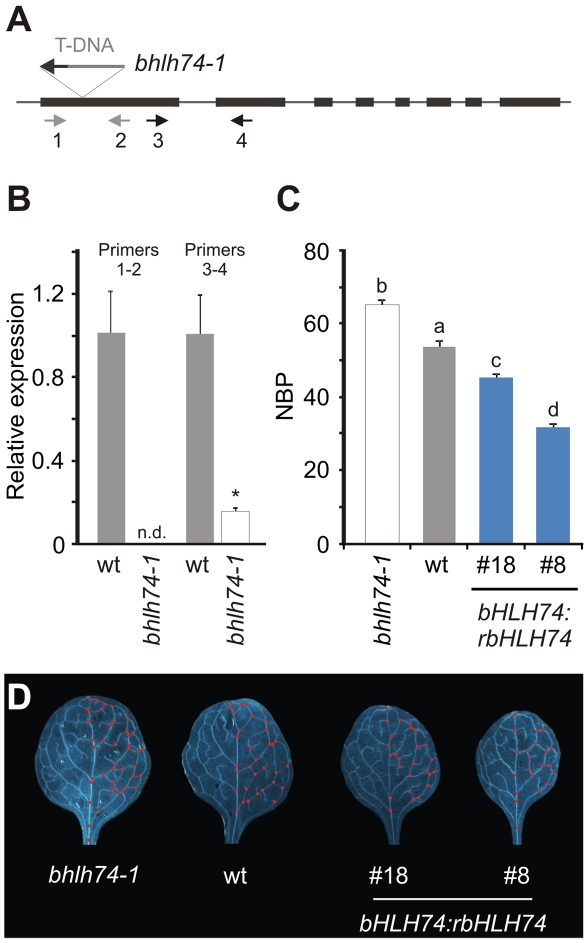
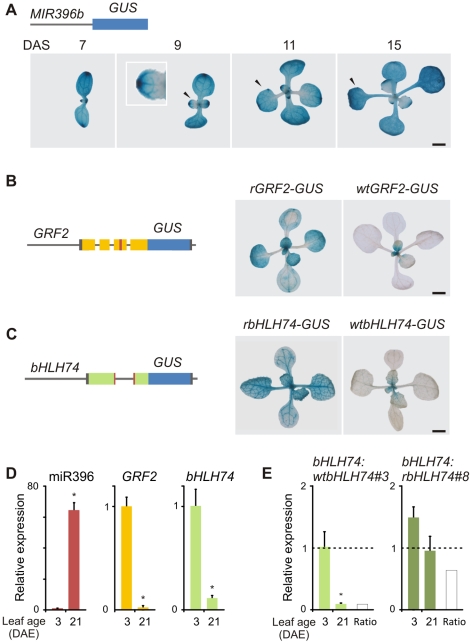
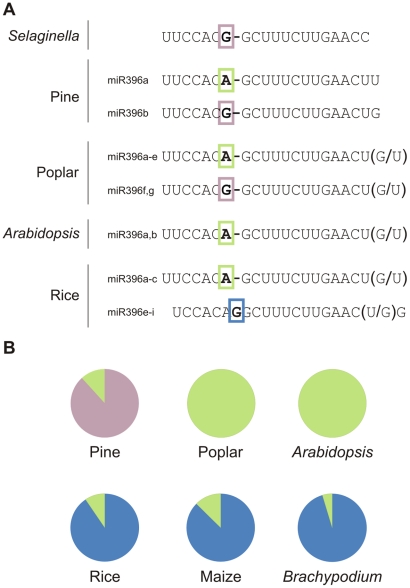
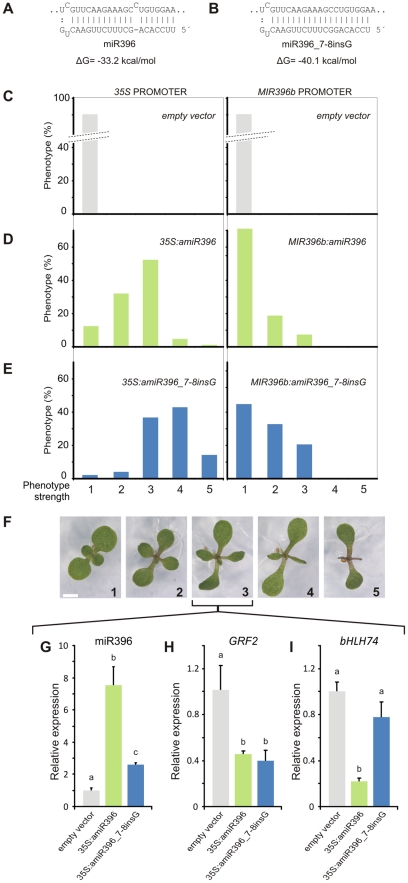
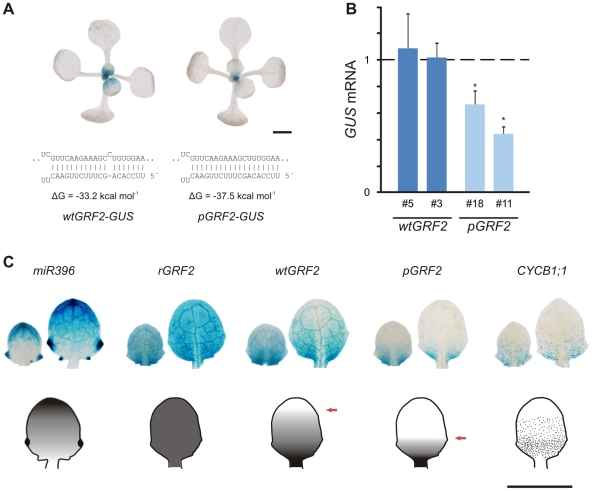
MicroRNAs (miRNAs) are ∼21 nt small RNAs that regulate gene expression in animals and plants. They can be grouped into families comprising different genes encoding similar or identical mature miRNAs. Several miRNA families are deeply conserved in plant lineages and regulate key aspects of plant development, hormone signaling, and stress response. The ancient miRNA miR396 regulates conserved targets belonging to the GROWTH-REGULATING FACTOR (GRF) family of transcription factors, which are known to control cell proliferation in Arabidopsis leaves. In this work, we characterized the regulation of an additional target for miR396, the transcription factor bHLH74, that is necessary for Arabidopsis normal development. bHLH74 homologs with a miR396 target site could only be detected in the sister families Brassicaceae and Cleomaceae. Still, bHLH74 repression by miR396 is required for margin and vein pattern formation of Arabidopsis leaves. MiR396 contributes to the spatio-temporal regulation of GRF and bHLH74 expression during leaf development. Furthermore, a survey of miR396 sequences in different species showed variations in the 5' portion of the miRNA, a region known to be important for miRNA activity. Analysis of different miR396 variants in Arabidopsis thaliana revealed that they have an enhanced activity toward GRF transcription factors. The interaction between the GRF target site and miR396 has a bulge between positions 7 and 8 of the miRNA. Our data indicate that such bulge modulates the strength of the miR396-mediated repression and that this modulation is essential to shape the precise spatio-temporal pattern of GRF2 expression. The results show that ancient miRNAs can regulate conserved targets with varied efficiency in different species, and we further propose that they could acquire new targets whose control might also be biologically relevant.


Conflict of interest statement

The authors have declared that no competing interests exist.

Figures

Figure 1
Figure 1. Analysis of potential miR396 targets in Arabidopsis thaliana.
(A) Scheme representing a typical GRF gene and the conservation of the target site in selected angiosperm and gymnosperm species. Conserved positions across all species are indicated by asterisks. Note that the number of exons might vary among GRF genes. See Table S4 for accession numbers of sequences used. (B) Scheme representing the strategy used to identify new miR396 targets of potential biological significance. Target search was performed over the TAIR9 database using the WMD3 target search tool (http://wmd3.weigelworld.org/), allowing 5 mismatches and gaps in the miRNA-target pairs. Predicted targets are shown in Table S1. (C) Diagram showing putative miR396 targets that are up-regulated at least 30% in miRNA mutants , . Expression levels were obtained from Genevestigator (www.genevestigator.com). (D,E) Modified RACE-PCR mapping of At1g10120 and At5g24660 mRNA cleavage sites. Red arrows indicate predicted miR396 cleavage sites. (F) At1g10120 and At5g24660 transcript levels in different small RNA mutant plants estimated by RT-qPCR. Data shown are mean ± SEM of 3 biological replicates. See Table S7 for a list of mutant alleles used. (G) At1g10120 and At5g24660 transcript levels in plants expressing an artificial target-mimic against miR396 (MIM396) estimated by RT-qPCR. Data shown are mean ± SEM of 3 biological replicates. (H) Scheme representing the At1g10120 locus. The miR396 target site is formed after the splicing of the first two exons. Target site conservation in several species is indicated (see Table S4 for accession numbers of sequences used). Conserved positions across all species are indicated by asterisks.
Figure 2
Figure 2. Characterization of transgenic plants expressing a miR396-resistant bHLH74.
(A) Schematic representation of bHLH74 and rbHLH74 constructs. (B) bHLH74 transcript levels estimated by RT-qPCR in mature leaves of plants expressing a wild-type (bHLH74:wtbHLH74) or miR396-resistant (bHLH74:rbHLH74) form of the gene encoding the transcription factor. Data shown are mean ± SEM of 3 biological replicates. Asterisks indicate significant differences between transgenic and wild-type plants, as determined by ANOVA (P<0.05). (C) Angle determination at the distal tip of leaf #5 in transgenics depicted on panel (B). Asterisks indicate significant differences between transgenics and wild-type plants, as determined by ANOVA (P<0.05). (D) Morphology of fully-expanded leaf #5. The different angles at the distal edge of the leaf are highlighted in yellow for wild-type and bHLH74:rbHLH74 leaves. An inset on the right shows the difference in venation (secondary veins are highlighted in red), with the number of branching points (NBP) indicated below. Data shown are mean ± SEM of 8 biological replicates. Scale Bar: 1 cm. (E) Scheme highlighting differences in leaf edges of wild-type and miR396-resistant bHLH74 plants.
Figure 3
Figure 3. Analysis of bhlh74 mutants.
(A) Scheme of the bHLH74 locus showing the T-DNA insertion corresponding to the GABI-Kat 720G11 line. Arrows indicate the pairs of primers (1–2 or 3–4, see also Table S7) used to quantify bHLH74 transcript levels by RT-qPCR. (B) bHLH74 transcript levels in wt and bhlh74-1 (GABI-Kat 720G11) seedlings (12–day old), using pairs of primers shown in (A). Data shown are mean ± SEM of 3 biological replicates; n.d.: not detected. Asterisks indicate significant differences between mutant and wild-type plants, as determined by ANOVA (P<0.05). (C) Number of branching points (NBP) in fully-expanded first leaves of wt, bhlh74-1 and bHLH74:rbHLH74 (lines #18 and #8) plants. Bars marked with different letters are significantly different as determined by ANOVA and Duncan's multiple range test (P<0.05). (D) Fully-expanded leaves (#1) from wt, bhlh74-1 and bHLH74:rbHLH74 (lines #18 and #8) plants. Red dots highlight branching points.
Figure 4
Figure 4. MiR396 coordinates the spatio-temporal expression of bHLH74 and GRF2.
(A) GUS staining of MIR396b:GUS plants of different age. Arrowheads show leaf #1. Numerals indicate plant age expressed in DAS (Days After Sowing). The inset shows a closer look at a developing leaf displaying a miR396 expression gradient. (B) GUS staining of wtGRF2-GUS (right) and rGRF2-GUS lines (15-day old). rGRF2-GUS has synonymous mutations in the miR396-target site. Left, scheme representing the reporters. The upstream regulatory regions and the first 4 exons were fused to GUS. The miRNA-target site is indicated in red. (C) GUS staining of wtbHLH74-GUS (right) and rbHLH74-GUS lines (15-day old). rbHLH74-GUS has synonymous mutations in the miR396 target site. Left, scheme representing the reporters. The upstream regulatory regions and the first 2 exons were fused to GUS. The miRNA target site is indicated in red. (D) miR396, GRF2 and bHLH74 RNA levels estimated by RT-qPCR in wild-type leaf #5 (DAE: Days After leaf #5 Emergence). Data shown are mean ± SEM of 3 biological replicates. Asterisks indicate significant differences between leaves, as determined by ANOVA (P<0.05). (E) bHLH74 expression levels at different ages of leaf #5 in bHLH74:wtbHLH74 and bHLH74:rbHLH74 plants. Expression levels were normalized to 3 DAE of the bHLH74:wtbHLH74 line #3. Data are mean ± SEM of 3 biological replicates. Asterisks indicate significant differences between leaves, as determined by ANOVA (P<0.05). Scale Bars: 2 mm.
Figure 5
Figure 5. Variations among miR396 family members in plants.
(A) MiR396 family composition of selected species. Differences in the 5′ region are highlighted with colored boxes, while variations at the 3′ end for each case are indicated in parentheses. (B) Diagrams showing the relative abundance of miR396 variants in pine, poplar, Arabidopsis and monocot libraries according to deep sequencing data (see Table S5).
Figure 6
Figure 6. The monocot-version of miR396 is hyperactive towards the GRFs.
(A,B) Scheme showing the interaction between Arabidopsis GRF2 and either miR396a (A) or rice miR396e,f (miR396_7-8insG) (B), which is a monocot-specific variant. (C–E) Phenotype frequency in independent transgenic plants (T1) expressing an empty vector (C), Arabidopsis miR396a (D), rice miR396e,f (miR396_7-8insG) (E). MiR396a and miR396_7-8insG were expressed from the viral 35S (left) and MIR396b (right) promoters. At least 100 independent transgenic plants were scored for each vector. (F) Phenotypes of transgenic plants (12-day old seedlings) harboring the different vectors. Phenotypes were classified according to the area reduction in leaves #1 and #2. Scale Bar: 2 mm. (G) to (I) miR396, GRF2 and bHLH74 levels in control plants (transformed with an empty vector, gray) and transgenic plants overexpressing Arabidopsis miR396a (light green) or miR396_7-8insG (blue) displaying an intermediate phenotype. RNA levels were determined by RT-qPCR using pools of 20 independent T1 seedlings. Data shown are mean ± SEM of 3 biological replicates. Bars marked with different letters are significantly different as determined by ANOVA and Duncan's multiple range test (P<0.05).
Figure 7
Figure 7. Activity of endogenous miR396 towards different substrates in Arabidopsis thaliana.
(A) GUS stainings of typical transgenic plants harboring wtGRF2 and pGRF2 reporters (15-day old seedlings). Sensors were built by fusing the upstream regulatory regions of GRF2 and its first 4 exons to GUS. The miR396 target site was modified as indicated below the pictures. Interaction energy values for miR396b are indicated below each miRNA-target pair. Scale Bar: 2 mm. (B) Expression levels of GRF2-GUS RNA in leaves #1 and #2 (15-day old seedlings) of the different sensors. Two representative lines for each vector out of a total of 20 independent lines were selected. Expression levels were normalized to wtGRF2-GUS line #3. Data shown are mean ± SEM of 4 biological replicates. Asterisks indicate significant differences between plants harboring different transgenes, as determined by ANOVA (P<0.05). (C) GUS staining in developing leaves #4 (right) and #5 (left) of transgenic plants harboring miR396, rGRF2, wtGRF2, pGRF2 and CYCLIN B1;1 reporters (14-day old seedlings). Scale Bar: 1 mm.

Similar articles

Cited by

References

    1. Voinnet O. Origin, biogenesis, and activity of plant microRNAs. Cell. 2009;136:669–687. - PubMed
    1. Jones-Rhoades MW, Bartel DP, Bartel B. MicroRNAS and their regulatory roles in plants. Annu Rev Plant Biol. 2006;57:19–53. - PubMed
    1. Chen X. MicroRNA metabolism in plants. Curr Top Microbiol Immunol. 2008;320:117–136. - PMC - PubMed
    1. Griffiths-Jones S, Saini HK, van Dongen S, Enright AJ. miRBase: tools for microRNA genomics. Nucleic Acids Res. 2008;36:D154–158. - PMC - PubMed
    1. Meyers BC, Axtell MJ, Bartel B, Bartel DP, Baulcombe D, et al. Criteria for Annotation of Plant MicroRNAs. Plant Cell 2008 - PMC - PubMed

Publication types

MeSH terms