. 2012 Jan;8(1):e1002433.
doi: 10.1371/journal.pgen.1002433. Epub 2012 Jan 5.

Genome-wide assessment of AU-rich elements by the AREScore algorithm

Affiliations

Genome-wide assessment of AU-rich elements by the AREScore algorithm

Milan Spasic et al. PLoS Genet. 2012 Jan.

Abstract

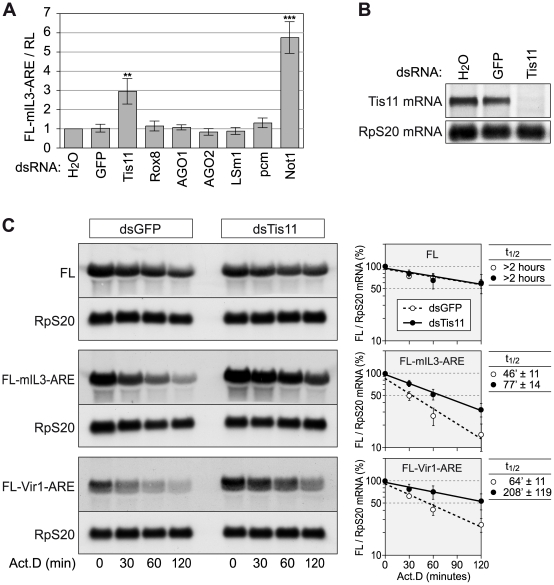
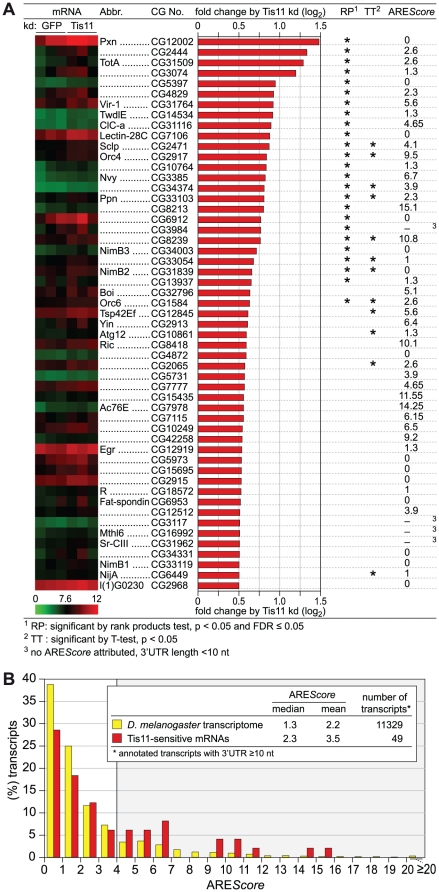
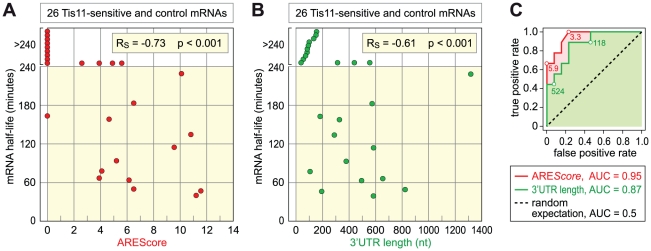
In mammalian cells, AU-rich elements (AREs) are well known regulatory sequences located in the 3' untranslated region (UTR) of many short-lived mRNAs. AREs cause mRNAs to be degraded rapidly and thereby suppress gene expression at the posttranscriptional level. Based on the number of AUUUA pentamers, their proximity, and surrounding AU-rich regions, we generated an algorithm termed AREScore that identifies AREs and provides a numerical assessment of their strength. By analyzing the AREScore distribution in the transcriptomes of 14 metazoan species, we provide evidence that AREs were selected for in several vertebrates and Drosophila melanogaster. We then measured mRNA expression levels genome-wide to address the importance of AREs in SL2 cells derived from D. melanogaster hemocytes. Tis11, a zinc finger RNA-binding protein homologous to mammalian tristetraprolin, was found to target ARE-containing reporter mRNAs for rapid degradation in SL2 cells. Drosophila mRNAs whose expression is elevated upon knock down of Tis11 were found to have higher AREScores. Moreover high AREScores correlate with reduced mRNA expression levels on a genome-wide scale. The precise measurement of degradation rates for 26 Drosophila mRNAs revealed that the AREScore is a very good predictor of short-lived mRNAs. Taken together, this study introduces AREScore as a simple tool to identify ARE-containing mRNAs and provides compelling evidence that AREs are widespread regulatory elements in Drosophila.


Conflict of interest statement

The authors have declared that no competing interests exist.

Figures

Figure 1
Figure 1. Numerical assessment of AREs using the AREScore algorithm.
(A) The AREScore is based on counting the number of AUUUA pentamers per 3′UTR or sequence. The proximity between pentamers and the occurrence of pentamers within larger AU-blocks adds to the score. Sequences to be analyzed can be entered either as a list of Refseq IDs or in FASTA format. A web-based version of the AREScore algorithm is available under http://arescore.dkfz.de/arescore.pl. (B) Relationship between AREScore and genome-wide mRNA half-lives from a study in human DG75 B-cells . The red curve corresponds to non-linear lowess regression, RS to the Spearman rank correlation coefficient. (C) mRNAs depicted in panel B were grouped according to their AREScore and set in relation to the average half-life in each group. (D) ROC analysis was applied to the data in panel B, testing every possible AREScore value for its ability to discriminate the 10% most short-lived mRNAs from the 10% most long-lived mRNAs. AUC, area under the curve. Maximum AREScores with a true positive rate of at least 0.5 and 0.8, respectively, are indicated by dotted lines. (E) Relationship between AREScore and genome-wide mRNA half-lives from a study in mouse NIH3T3 fibroblasts . Analysis was performed as in panel E. (F) mRNAs depicted in panel E were grouped according to their AREScore, and set in relation to the average half-life in each group. (G) ROC analysis for the data in panel E, as in panel D. (H) AREScore distribution of TTP-associated mRNAs in mouse RAW264.7 macrophages from an RNA-IP study . AREScore frequencies are plotted for 135 mRNAs that were enriched by immunoprecipitation of TTP. As controls, AREScore frequencies are shown for a group of 135 randomly concatenated 3′UTR sequences matching in size to the TTP-associated 3′UTRs, and for the 3′UTRs ≥10 nt in size of all annotated mouse mRNAs.
Figure 2
Figure 2. AREScore distribution in different metazoa.
(A) The AREScore was determined for every annotated transcript with a 3′UTR length ≥10 nt, for Caenorhabditis elegans, Drosophila melanogaster, Danio rerio, Mus musculus and Homo sapiens. mRNAs were grouped according to AREScores of 0–0.99, 1–1.99, 2–2.99, etc. The graph shows the frequency of mRNAs in each group using a linear scale. (B) The same distribution as in panel A is shown on a logarithmic scale to better visualize the low abundant mRNAs with high AREScores; frequencies of 0 were omitted from the graph. (C) The same distribution as in panel A is depicted using cumulative frequencies on a linear scale. (D) The 3′UTR length distribution was plotted for the same set of transcripts. mRNAs were grouped according to 3′UTR lengths of 10–99, 100–199, 200–299, … 1000–1499, 1500–1999, … 4500–4999, and ≥5000 nt.
Figure 3
Figure 3. AREScore distribution in comparison to randomized controls.
(A) The AREScore distribution of the H. sapiens transcriptome (every annotated transcript with a 3′UTR length ≥10 nt) was compared to a fully adjusted, randomized control set of sequences with identical lengths and A/T/G/C-content. Percentage of transcripts is depicted on a logarithmic scale. (B) The same analysis was done with the D. melanogaster transcriptome, as in panel A. Frequencies of 0 were omitted from the graph. (C) The same analysis was done with the C. elegans transcriptome, as in panel B. (D) The frequency of mRNAs with an AREScore ≥10 in the actual transcriptome of 14 species was compared to the frequency in fully adjusted, randomized control sequences. The analysis was carried out for Amphimedon queenslandica (demosponge), Hydra magnipapillata (freshwater polyp), Aplysia californica (California sea hare), Caenorhabditis elegans (roundworm), Ixodes scapularis (deer tick), Drosophila melanogaster (fruit fly), Strongylocentrotus purpuratus (purple sea urchin), Ciona intestinalis (vase tunicate), Branchiostoma floridae (Florida lancelet), Danio rerio (zebrafish), Xenopus laevis (African clawed frog), Gallus gallus (chicken), Mus musculus (common house mouse) and Homo sapiens (man). The Φ coefficient serves as a measure for how strongly AREScores ≥10 are associated with the actual transcriptome as compared to the randomized control. P-values were calculated by χ2-test, n represents the number of transcripts. Species labeled in red show a significant enrichment of mRNAs with AREScores ≥10.
Figure 4
Figure 4. Tis11 mediates rapid mRNA degradation in D. melanogaster SL2 cells.
(A) To knock down the expression of several mRNA decay factors, SL2 cells were treated with dsRNA (12.5 µg/ml) over a period of 4 days. For control, cells were treated with water alone, or with a dsRNA targeting GFP. On day 3, cells were transfected with a firefly luciferase (FL) reporter containing the ARE of mouse IL3 (pRp128-FL-mIL3-ARE) together with pRp128-RL encoding Renilla luciferase (RL). FL and RL activities were measured on day 5 and normalized to the water control. The graph shows average FL-mIL3-ARE/RL ratios ± SD based on 4–9 biological repeats. In comparison to the GFP control, dsRNAs targeting Tis11 or Not1 cause a highly significant increase with p-values of (**) 1.6×10⁻⁶ and (***) 3.3×10⁻⁹, respectively. (B) The Tis11 knock down efficiency was examined after treatment of SL2 cells with dsRNA for 5 days. Total RNA was extracted, and 8 µg per sample were subjected to Northern blot analysis using a probe against Tis11 mRNA. Ribosomal protein RpS20 mRNA serves as a loading control. (C) To measure reporter mRNA stability, SL2 cells were treated with dsRNAs against GFP or Tis11 over a period of 4 days, and transiently transfected with Ac5-FL, Ac5-FL-mIL3-ARE or Ac5-FL-Vir1-ARE on day 3. On day 5, cells were treated with actinomycin D (5 µg/ml), and total RNA was extracted after 0, 30, 60 and 120 minutes. Per sample, 4–5 µg of RNA were subjected to Northern blot analysis. mRNA signal intensities from three (FL) or four (IL3, Vir1) biological repeat experiments were quantified, and the average FL/RpS20 ratio ± SE was plotted against time in the panels on the right side. mRNA half-lives are given as average values ± SE.
Figure 5
Figure 5. Analysis of Tis11-sensitive mRNAs in D. melanogaster SL2 cells.
(A) D. melanogaster SL2 cells were treated over a period of 4 days with 12.5 µg/ml dsRNA in order to knock down Tis11, or with dsRNA targeting GFP as a control. Total RNA was extracted from three biological repeats for microarray analysis using the Affymetrix Drosophila Genome 2.0 array. After normalization of the signal intensities using Robust Multi-array Analysis (RMA), the fold change of expression by Tis11 kd (signal in Tis11 kd/signal in GFP kd) was calculated. The list shows all 53 mRNAs with a log2-transformed fold change of >0.5, i.e. a fold change of >1.41. Statistical significance was determined by rank products (RP) test and independently by Student's T-test (TT). A heat map of the signal intensities in the three biological repeats is provided on the left side, the AREScore is shown on the right side. (B) The AREScore distribution is depicted for 49 out of the 53 Tis11-sensitive mRNAs identified in panel A. Only mRNAs with an annotated 3′UTR length ≥10 nt were included. The AREScore distribution of the entire D. melanogaster transcriptome serves as the control group.
Figure 6
Figure 6. Relationship among AREScore, 3′UTR length, and mRNA expression level.
(A) For 6657 Drosophila mRNAs with a 3′UTR ≥10 nt, the log2-transformed expression levels, as measured by microarray analysis in SL2 cells under control conditions (dsGFP), were plotted against the AREScore. The red curve corresponds to non-linear lowess regression. (B) The 6657 mRNAs were grouped into 9 categories according to their AREScore: 0–0.99; 1–1.99; 2–2.99; 3–3.99; 4–5.99; 6–7.99; 8–11.99; 12–15.99; and ≥16. Average expression levels ± SE were determined for each group and plotted in the graph, the number n of mRNAs within each group is indicated. Asterisks mark statistically significant differences in comparison to the average expression level of all 6657 mRNAs, as determined by Student's T-test. (C) The 3′UTR length of all 6657 mRNAs was plotted against the AREScore. The red curve corresponds to non-linear lowess regression. (D) The log2-transformed expression levels of all 6657 mRNAs were plotted against the 3′UTR length. The red curve corresponds to non-linear lowess regression. (E) The 6657 mRNAs were grouped into 9 categories according to their 3′UTR length: 10–99; 100–199; 200–299; 300–399; 400–499; 500–999; 1000–1499; 1500–1999; and ≥2000 nt. Average expression levels ± SE were represented as in panel B. (F) For the 1781 mRNAs with a 3′UTR length between 200 and 499 nt, the log2-transformed expression levels were plotted against the 3′UTR length. The red curve corresponds to non-linear lowess regression, R to the Pearson correlation coefficient. (G), For the same 1781 mRNAs, the log2-transformed expression levels were plotted against the AREScore. (H) The same 1781 mRNAs were divided into two groups based on AREScores of 0–7.99 and ≥8. The same mRNAs were also divided into two equally large groups according to the 3′UTR length, and average expression levels ± SE were determined for each group.
Figure 7
Figure 7. Relationship among AREScore, 3′UTR length, and mRNA half-lives.
(A) The half-lives of 26 Tis11-sensitive and control mRNAs, as measured by qPCR in SL2 cells subjected to control GFP dsRNA, were set in relation to their AREScore. Half-lives above 240 minutes could not be determined accurately, and were presented without scale in the white area at the top of the graph. RS, Spearman rank correlation coefficient. (B) The half-lives of the same mRNAs were compared to their 3′UTR length. Half-lives above 240 minutes could not be determined accurately, and were presented without scale in the white area at the top of the graph. (C) ROC analysis was applied to the 26 mRNAs, testing the ability of both AREScore and 3′UTR length to discriminate mRNAs with a half-life <140 minutes from mRNAs with a half-life >240 minutes. AUC, area under the curve.

Similar articles

Cited by

References

    1. Moore MJ. From birth to death: the complex lives of eukaryotic mRNAs. Science. 2005;309:1514–1518. - PubMed
    1. Raghavan A, Ogilvie RL, Reilly C, Abelson ML, Raghavan S, et al. Genome-wide analysis of mRNA decay in resting and activated primary human T lymphocytes. Nucleic Acids Res. 2002;30:5529–5538. - PMC - PubMed
    1. Hao S, Baltimore D. The stability of mRNA influences the temporal order of the induction of genes encoding inflammatory molecules. Nat Immunol. 2009;10:281–288. - PMC - PubMed
    1. Wang Y, Liu C, Storey J, Tibshirani R, Herschlag D, et al. Precision and functional specificity in mRNA decay. Proc Natl Acad Sci USA. 2002;99:5860–5865. - PMC - PubMed
    1. Caput D, Beutler B, Hartog K, Thayer R, Brown-Shimer S, et al. Identification of a common nucleotide sequence in the 3′-untranslated region of mRNA molecules specifying inflammatory mediators. Proc Natl Acad Sci USA. 1986;83:1670–1674. - PMC - PubMed

Publication types

MeSH terms

Associated data