. 2012 Jan;8(1):e1002437.
doi: 10.1371/journal.pgen.1002437. Epub 2012 Jan 5.

Checkpoints in a yeast differentiation pathway coordinate signaling during hyperosmotic stress

Affiliations

Checkpoints in a yeast differentiation pathway coordinate signaling during hyperosmotic stress

Michal J Nagiec et al. PLoS Genet. 2012 Jan.

Abstract

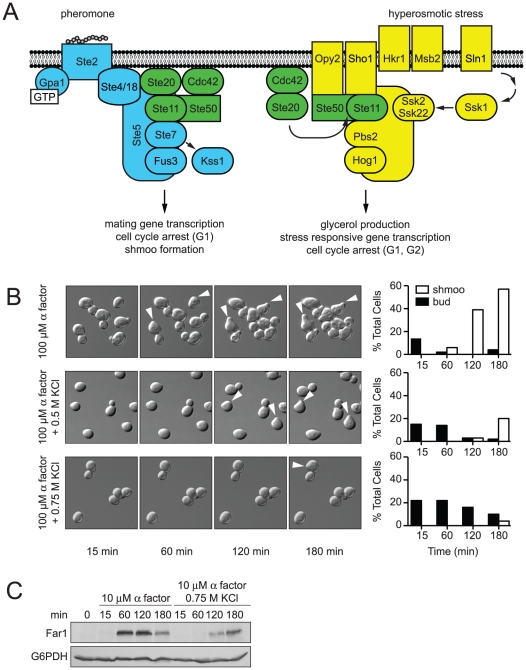
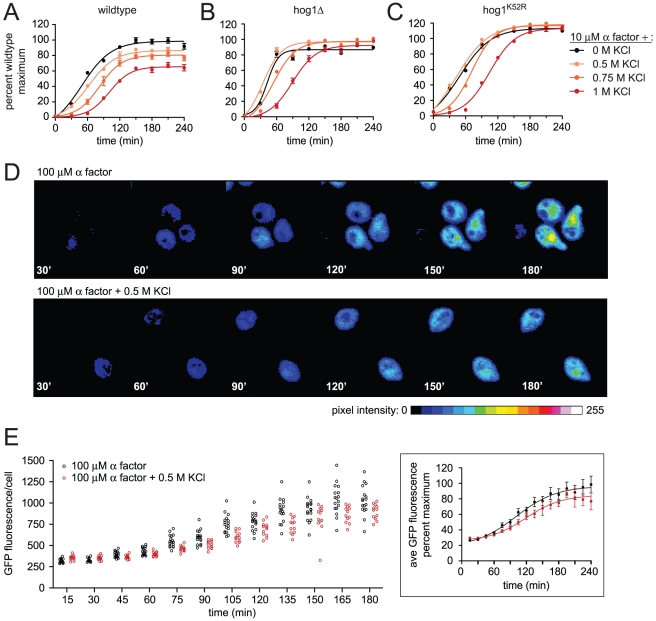
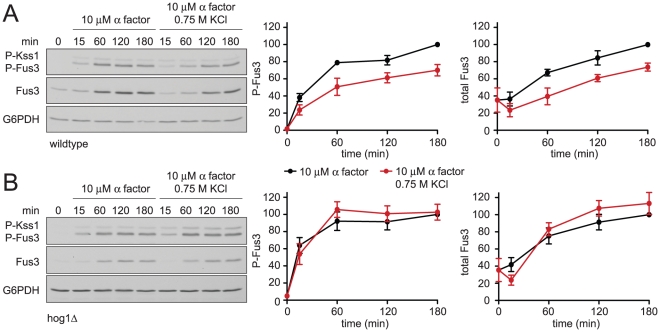
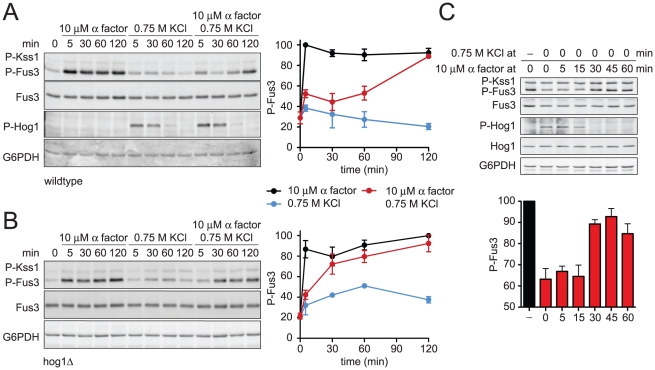
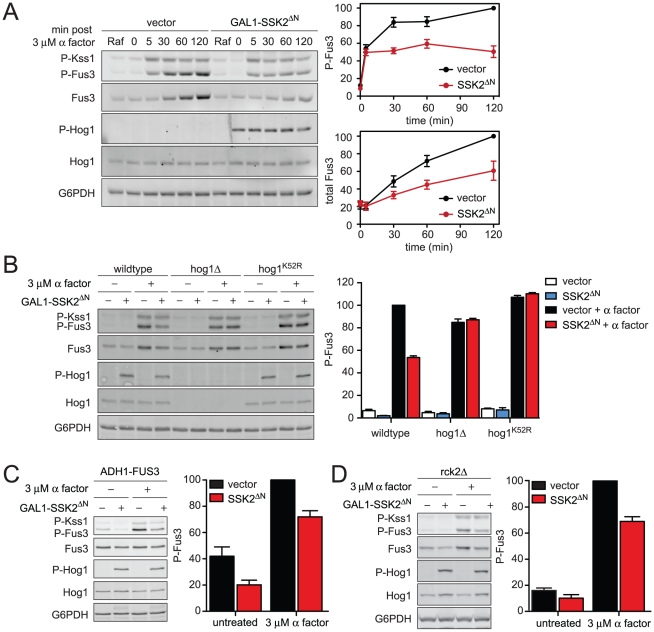
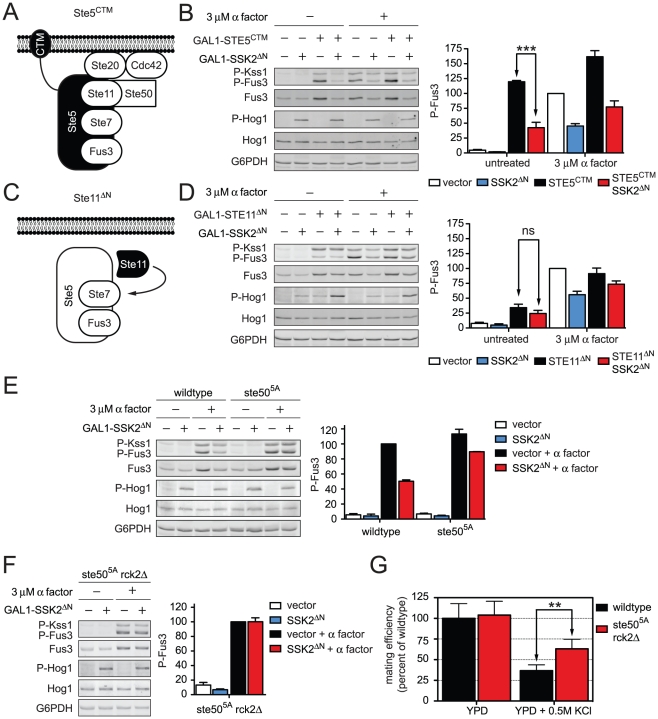
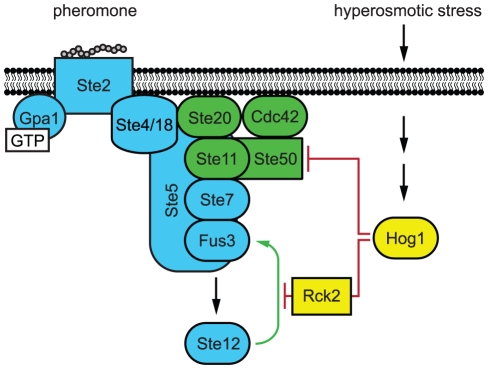
All eukaryotes have the ability to detect and respond to environmental and hormonal signals. In many cases these signals evoke cellular changes that are incompatible and must therefore be orchestrated by the responding cell. In the yeast Saccharomyces cerevisiae, hyperosmotic stress and mating pheromones initiate signaling cascades that each terminate with a MAP kinase, Hog1 and Fus3, respectively. Despite sharing components, these pathways are initiated by distinct inputs and produce distinct cellular behaviors. To understand how these responses are coordinated, we monitored the pheromone response during hyperosmotic conditions. We show that hyperosmotic stress limits pheromone signaling in at least three ways. First, stress delays the expression of pheromone-induced genes. Second, stress promotes the phosphorylation of a protein kinase, Rck2, and thereby inhibits pheromone-induced protein translation. Third, stress promotes the phosphorylation of a shared pathway component, Ste50, and thereby dampens pheromone-induced MAPK activation. Whereas all three mechanisms are dependent on an increase in osmolarity, only the phosphorylation events require Hog1. These findings reveal how an environmental stress signal is able to postpone responsiveness to a competing differentiation signal, by acting on multiple pathway components, in a coordinated manner.


Conflict of interest statement

The authors have declared that no competing interests exist.

Figures

Figure 1
Figure 1. Hyperosmotic stress delays mating differentiation.
(A) The mating pathway (blue) and the HOG pathway (yellow) share components (green). Overlapping lines indicate an interaction and activation of the downstream component, otherwise indicated by an arrow. The mating pathway , is activated when mating pheromone binds the receptor (Ste2) and activates a G protein. The Gβγ subunit dimer (Ste4/18) recruits the MAPK complex comprised of the scaffold (Ste5), MAPK (Fus3), MAPKK (Ste7), MAPKKK (Ste11) and the Ste11 adaptor protein Ste50 to the plasma membrane , . At the plasma membrane the small G-protein Cdc42 and the protein kinase Ste20 activate the assembled MAPK complex . Activated Fus3 induces gene transcription, cell cycle arrest, and cytoskeletal rearrangement –. Mating pheromone also activates a second MAPK, Kss1. Kss1 primarily activates the haploid filamentous growth response, but also contributes to a full mating response . The HOG pathway is activated by hyperosmotic conditions. Two branches, SHO1 and SLN1, detect hyperosmotic conditions. Hrk1 and Msb2 activate the SHO1 branch , which shares components with the mating pathway . The SLN1 branch activates the protein kinase Ssk1 , which activates the partially redundant MAPKKKs Ssk2 and Ssk22 . The SHO1 and SLN1 branches converge on the MAPKK, Pbs2, which serves as a scaffold for Ste11, Ssk2, Ssk22 and the MAPK, Hog1. Activated Hog1 induces glycerol production, gene transcription, and cell cycle arrest , , , , . (B) Shmoo formation was visualized by microscopy after incubation of cells treated with 100 µM α factor, 100 µM α factor+0.5 M KCl, or 100 µM α factor+0.75 M KCl. The percentages of cells with shmoos or buds are shown. (C) Induction kinetics of Far1; wild-type cells were stimulated with 10 µM α factor and co-stimulated with 10 µM α factor+0.75 M KCl. Cell lysates were resolved by 7.5% SDS-PAGE and Far1-HA detected by immunoblotting with anti-HA antibodies. Glucose-6-phosphate dehydrogenase (G6PDH) served as a loading control.
Figure 2
Figure 2. Hyperosmotic stress delays and dampens mating transcription.
Transcriptional activation (β-galactosidase activity) was measured spectrofluorometrically every 30 min in (A) wild-type, (B) hog1Δ, and (C) hog1K52R cells transformed with a plasmid containing a pheromone-inducible reporter (FUS1-lacZ). Transcription was induced by the addition of 10 µM α factor, 10 µM α factor+0.5 M KCl, 10 µM α factor+0.75 M KCl, or 10 µM α factor+1 M KCl. Data are the mean ± SE of four individual colonies measured in quadruplicate and presented as percentage of wild-type maximum. Transcriptional activation (GFP expression) was measured by fluorescence microscopy in individual wild-type cells with an integrated pheromone-inducible reporter (FUS1-GFP). (D) Representative images of GFP expression in G1 cells stimulated by the addition of 10 µM α factor or 10 µM α factor+0.5 M KCl. Color spectrum indicates GFP pixel intensity as calculated using ImageJ. (E) Scatter plot of GFP fluorescence (average pixel intensity/cell area) in individual cells stimulated with 10 µM α factor or 10 µM α factor+0.5 M KCl. Insert is the average GFP intensity from the population of individual cells in (E), error bars indicate 95% CI.
Figure 3
Figure 3. Hyperosmotic stress dampens mating MAPK activation and induction.
(A) Activation and induction kinetics of Fus3; wild-type cells were stimulated with 10 µM α factor or co-stimulated with 10 µM α factor+0.75 M KCl. Cell lysates were resolved by 12.5% SDS-PAGE. Phospho-Fus3 (P-Fus3) and phospho-Kss1 (P-Kss1) were detected by immunoblotting with phospho-p44/p42 antibodies, which recognize the dually phosphorylated and activated form of Fus3 and Kss1. Total Fus3 abundance was determined with Fus3 antibodies. G6PDH served as a loading control. All primary antibodies were recognized by chemiluminescent detection and quantified by scanning densitometry (ImageJ). The panels to the right show averaged scanning densitometry of three individual experiments. Error bars represent ± SEM. Co-stimulation dampened P-Fus3 by 29.9%±6.6% and total Fus3 by 26.2%±4.7% at 180 min. (B) hog1Δ cells treated as in A.
Figure 4
Figure 4. Hyperosmotic stress dampens Fus3 activation in a Hog1-dependent manner.
(A) Activation kinetics of Fus3 and Hog1; wild-type cells transformed with plasmid-borne GAL1-FUS3 were grown in SC and 2% galactose followed by stimulation with 10 µM α factor, 0.75 M KCl, or co-stimulation with 10 µM α factor+0.75 M KCl. Cell lysates were resolved by 12.5% SDS-PAGE. P-Fus3 and P-Kss1 were detected with phospho-p44/p42 antibodies. P-Hog1 was detected with phospho-p38 antibodies. Total Fus3 and Hog1 were detected with Fus3 and Hog1 antibodies. G6PDH served as a loading control. All primary antibodies were recognized by fluorescently labeled secondary antibody, detected by fluorescence scanner (Typhoon Trio) and quantified by scanning densitometry (ImageJ). The panel to the right shows averaged scanning densitometry of four individual experiments. Error bars represent ± SEM. Co-stimulation dampened P-Fus3 by 47.6%±2.2% at 5 min and 47.5%±6.6% at 30 min. (B) hog1Δ cells transformed with GAL1-FUS3 treated as in A. Co-stimulation dampened P-Fus3 by 44.3%±7.4% at 5 min and 7.4%±10.9% at 30 min. (C) Sequential stimulation of Hog1 and Fus3. Wild-type cells grown in SC with 2% dextrose stimulated with 0.75 M KCl, and after an indicated period of stress adaptation stimulated with 10 µM α factor for an additional 15 min. Error bars represent ± SEM.
Figure 5
Figure 5. Constitutively active Hog1 dampens Fus3 activation and induction.
(A) Activation kinetics of Fus3 with constitutively active Hog1; wild-type cells transformed with vector control or plasmid-borne GAL1-SSK2ΔN were grown in SC media with 2% raffinose (Raf). Ssk2ΔN expression was induced by addition of 2% galactose for 60 min followed by addition of 3 µM α factor for 30 min. Cell lysates were resolved by 12.5% SDS-PAGE. P-Fus3 and P-Kss1 were detected with phospho-p44/p42 antibodies. P-Hog1 was detected with phospho-p38 antibodies. Total Fus3 and Hog1 were detected with Fus3 and Hog1 antibodies. G6PDH served as a loading control. All primary antibodies were recognized by fluorescently labeled secondary antibody, detected by fluorescence scanner (Typhoon Trio) and quantified by scanning densitometry (ImageJ). The panels to the right show averaged scanning densitometry of four individual experiments. Error bars represent ± SEM. P-Hog1 reduced P-Fus3 by 49.4%±6.7% at 120 min. (B) Wild-type, hog1Δ, and, hog1K52R cells transformed with GAL1-SSK2ΔN or parent vector control were grown in SC and 2% galactose for 60 min followed by addition of 3 µM α factor or left untreated for 30 min. (C) fus3Δ cells transformed with ADH1-FUS3 and GAL1-SSK2ΔN or vector were grown and stimulated as in B. P-Hog1 (SSK2ΔN) reduced P-Fus3 by 30.7%±3.2%. (D) rck2Δ cells transformed with GAL1-SSK2ΔN or vector were grown and stimulated as in B. P-Hog1 reduced P-Fus3 by 31.0%±6.2%.
Figure 6
Figure 6. Hog1 dampens Fus3 activation by targeting Ste50.
Constitutive activators of mating pathway highlighted in black: (A) Ste5CTM, a C-terminal transmembrane domain (CTM) tethers Ste5 to the plasma membrane allowing MAPK activation without receptor or G-protein. (B) Wild-type cells transformed with GAL1-STE5CTM, GAL1-SSK2ΔN or parent vector controls were grown in 2% galactose for 60 min followed by addition of 3 µM α factor or left untreated for 30 min. Cell lysates were resolved by 12.5% SDS-PAGE. Statistical significance was calculated using two-way ANOVA. ***, p<0.001. (C) Ste11ΔN, constitutively active amino-terminus truncation mutant of Ste11, allowing activation without binding the upstream activator Ste20, scaffold Ste5, or adaptor Ste50. (D) Wild-type cells transformed with GAL1-STE11ΔN, GAL1-SSK2ΔN or vector were grown in 2% galactose for 2.5 h followed by addition of 3 µM α factor or left untreated for 30 min. Statistical significance was calculated using two-way ANOVA, ns – not significant, p>0.05. (E) Wild-type and ste505A cells grown and treated as in B. (F) ste505A rck2Δ cells grown and treated as in B. (G) Quantitative mating assay, indicated strains were mated with wild-type MATα strain for 4 h on YPD or YPD+0.5 M KCl. Statistical significance was calculated using two-way ANOVA. **, p<0.01.
Figure 7
Figure 7. Model of Hog1 pathway cross-inhibition.
Cells co-stimulated with mating pheromone and hyperosmotic stress adapt to stress before committing to mating differentiation. Hog1 coordinates mating and stress signals by limiting Fus3 activation through two mechanisms, (1) feedback phosphorylation of Ste50 and (2) feedforward phosphorylation of Rck2. Red lines indicate Hog1 mediated inhibition. Green line indicates the Fus3 positive feedback loop, which is disrupted by Rck2.

Similar articles

Cited by

References

    1. Johnson GL, Lapadat R. Mitogen-activated protein kinase pathways mediated by ERK, JNK, and p38 protein kinases. Science. 2002;298:1911–1912. - PubMed
    1. Qi M, Elion EA. MAP kinase pathways. J Cell Sci. 2005;118:3569–3572. - PubMed
    1. Chen RE, Thorner J. Function and regulation in MAPK signaling pathways: lessons learned from the yeast Saccharomyces cerevisiae. Biochim Biophys Acta. 2007;1773:1311–1340. - PMC - PubMed
    1. Dohlman HG, Thorner JW. Regulation of G protein-initiated signal transduction in yeast: paradigms and principles. Annu Rev Biochem. 2001;70:703–754. - PubMed
    1. Hohmann S. Osmotic stress signaling and osmoadaptation in yeasts. Microbiol Mol Biol Rev. 2002;66:300–372. - PMC - PubMed

Publication types

MeSH terms

Substances