

Mechanism and kinetics of inducible nitric oxide synthase auto-S-nitrosation and inactivation
- PMID: 22242685
- PMCID: PMC3277664
- DOI: 10.1021/bi201818c
Mechanism and kinetics of inducible nitric oxide synthase auto-S-nitrosation and inactivation
Abstract
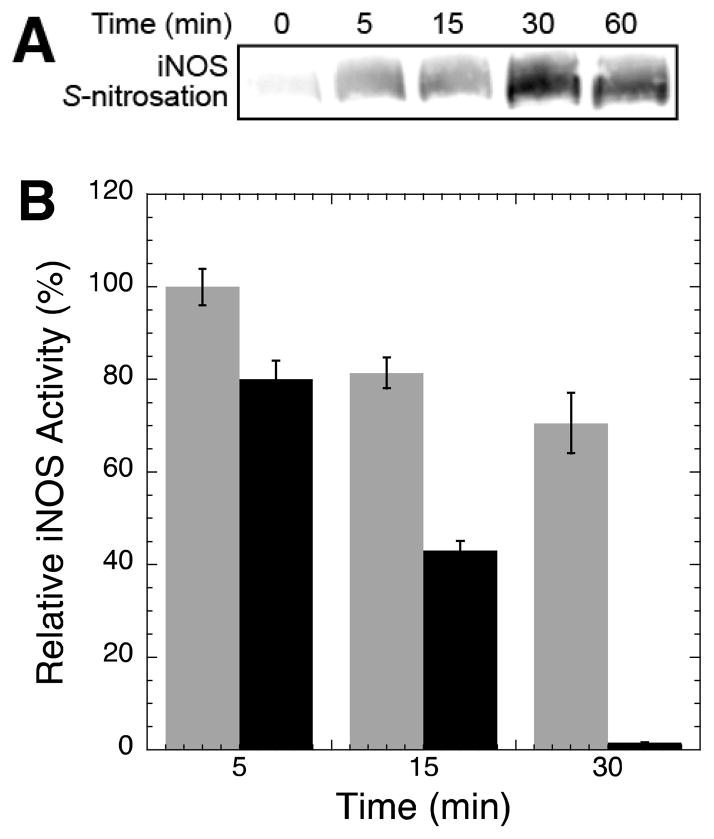
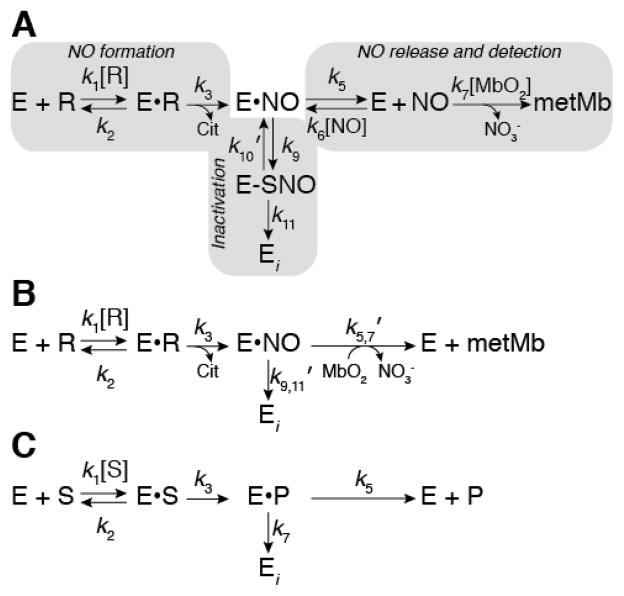
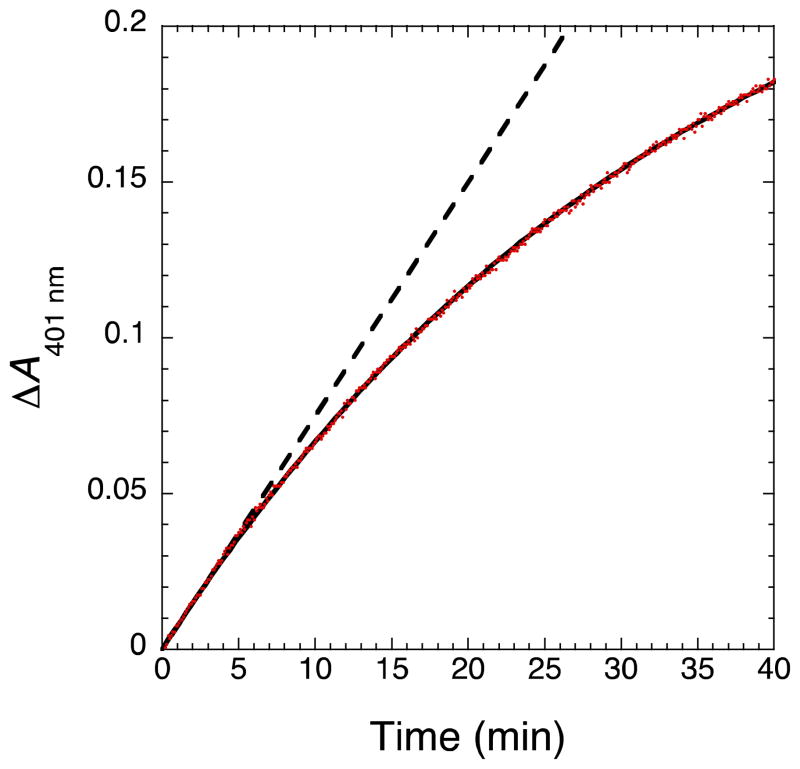
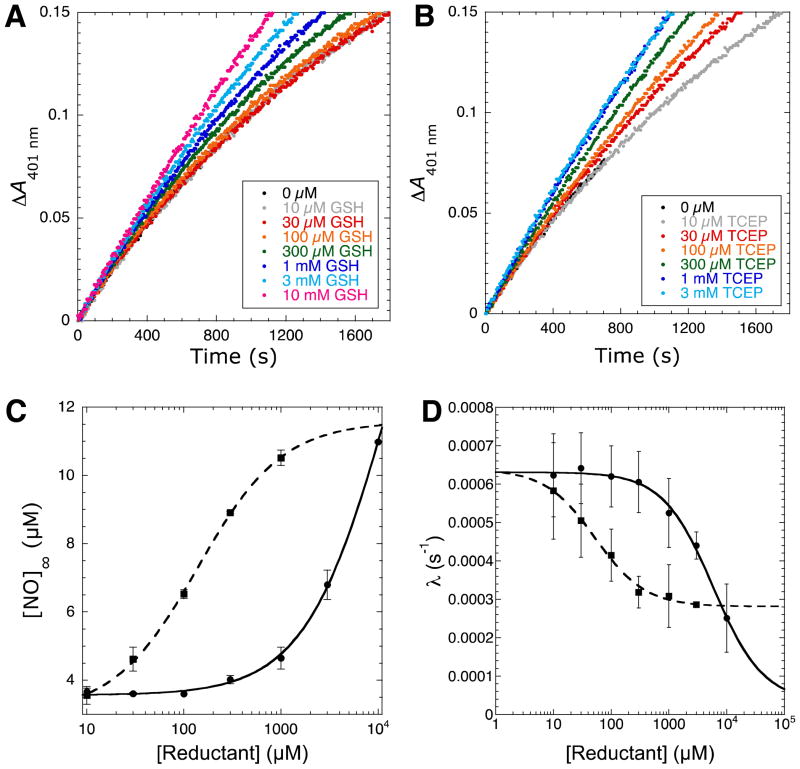
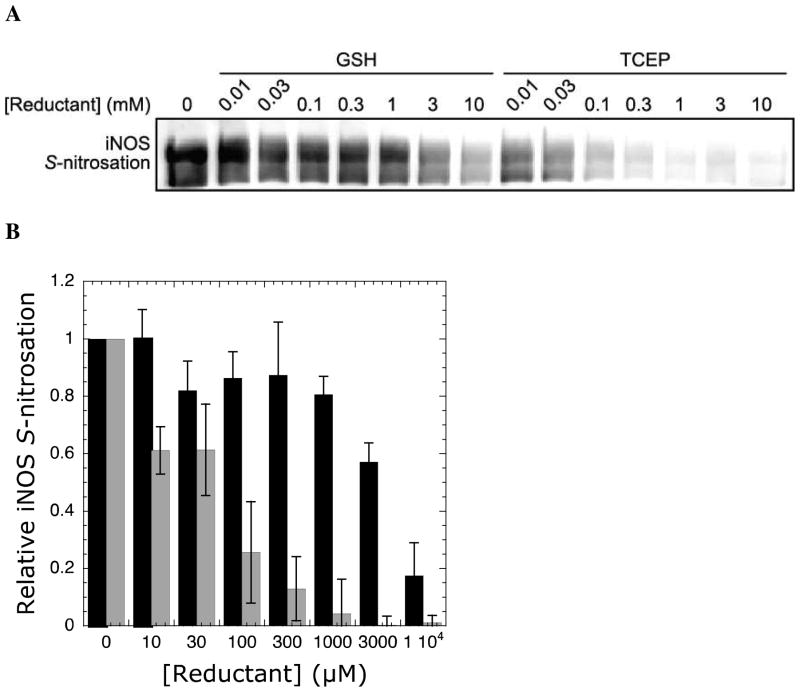
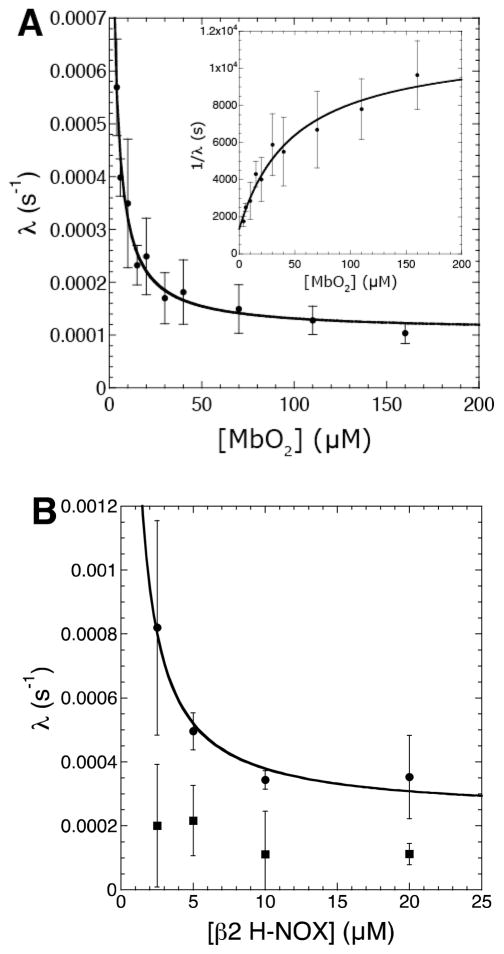
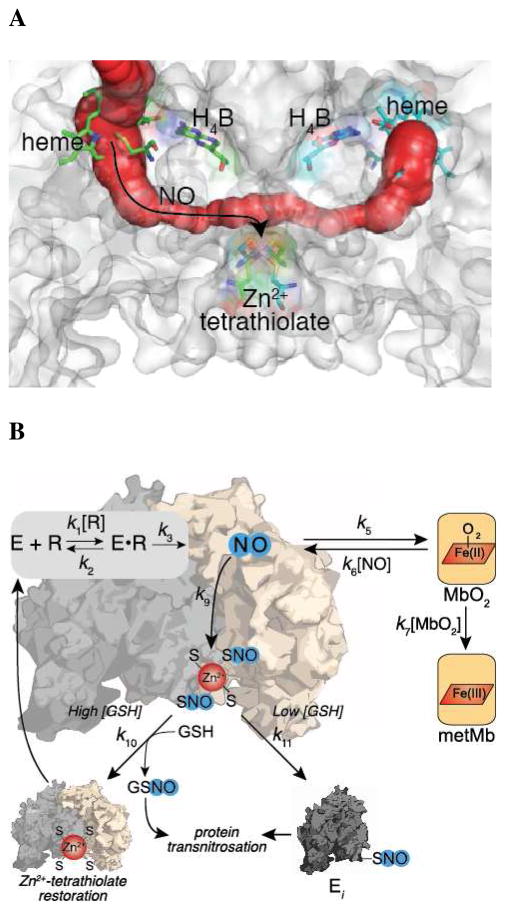
Nitric oxide (NO), the product of the nitric oxide synthase (NOS) reaction, was previously shown to result in S-nitrosation of the NOS Zn(2+)-tetrathiolate and inactivation of the enzyme. To probe the potential physiological significance of NOS S-nitrosation, we determined the inactivation time scale of the inducible NOS isoform (iNOS) and found it directly correlates with an increase in the level of iNOS S-nitrosation. A kinetic model of NOS inactivation in which arginine is treated as a suicide substrate was developed. In this model, NO synthesized at the heme cofactor is partitioned between release into solution (NO release pathway) and NOS S-nitrosation followed by NOS inactivation (inactivation pathway). Experimentally determined progress curves of NO formation were fit to the model. The NO release pathway was perturbed through addition of the NO traps oxymyoglobin (MbO(2)) and β2 H-NOX, which yielded partition ratios between NO release and inactivation of ~100 at 4 μM MbO(2) and ~22000 at saturating trap concentrations. The results suggest that a portion of the NO synthesized at the heme cofactor reacts with the Zn(2+)-tetrathiolate without being released into solution. Perturbation of the inactivation pathway through addition of the reducing agent GSH or TCEP resulted in a concentration-dependent decrease in the level of iNOS S-nitrosation that directly correlated with protection from iNOS inactivation. iNOS inactivation was most responsive to physiological concentrations of GSH with an apparent K(m) value of 13 mM. NOS turnover that leads to NOS S-nitrosation might be a mechanism for controlling NOS activity, and NOS S-nitrosation could play a role in the physiological generation of nitrosothiols.
Figures
Similar articles
-
Mechanisms of S-nitrosothiol formation and selectivity in nitric oxide signaling.Curr Opin Chem Biol. 2012 Dec;16(5-6):498-506. doi: 10.1016/j.cbpa.2012.10.016. Epub 2012 Nov 3. Curr Opin Chem Biol. 2012. PMID: 23127359 Free PMC article. Review.
-
S-Nitrosation and regulation of inducible nitric oxide synthase.Biochemistry. 2005 Mar 29;44(12):4636-47. doi: 10.1021/bi0474463. Biochemistry. 2005. PMID: 15779890
-
Nitric-oxide synthase forms N-NO-pterin and S-NO-cys: implications for activity, allostery, and regulation.J Biol Chem. 2010 Oct 8;285(41):31581-9. doi: 10.1074/jbc.M109.072496. Epub 2010 Jul 21. J Biol Chem. 2010. PMID: 20659888 Free PMC article.
-
Mechanistic studies of inactivation of inducible nitric oxide synthase by amidines.Biochemistry. 2015 Apr 21;54(15):2530-8. doi: 10.1021/acs.biochem.5b00135. Epub 2015 Apr 7. Biochemistry. 2015. PMID: 25811913 Free PMC article.
-
Nitrosothiol formation and S-nitrosation signaling through nitric oxide synthases.Nitric Oxide. 2017 Feb 28;63:52-60. doi: 10.1016/j.niox.2016.10.001. Epub 2016 Oct 5. Nitric Oxide. 2017. PMID: 27720836 Review.
Cited by
-
S-Nitroso-l-cysteine and ventilatory drive: A pediatric perspective.Pediatr Pulmonol. 2022 Oct;57(10):2291-2297. doi: 10.1002/ppul.26036. Epub 2022 Jul 24. Pediatr Pulmonol. 2022. PMID: 35785452 Free PMC article. Review.
-
Nitric oxide and the brain. Part 2: Effects following neonatal brain injury-friend or foe?Pediatr Res. 2021 Mar;89(4):746-752. doi: 10.1038/s41390-020-1021-4. Epub 2020 Jun 20. Pediatr Res. 2021. PMID: 32563184 Review.
-
A Conspectus of Cellular Mechanisms of Nitrosothiol Formation from Nitric Oxide.For Immunopathol Dis Therap. 2012;3(2):183-191. doi: 10.1615/ForumImmunDisTher.2012006372. For Immunopathol Dis Therap. 2012. PMID: 23503678 Free PMC article.
-
Mechanisms of S-nitrosothiol formation and selectivity in nitric oxide signaling.Curr Opin Chem Biol. 2012 Dec;16(5-6):498-506. doi: 10.1016/j.cbpa.2012.10.016. Epub 2012 Nov 3. Curr Opin Chem Biol. 2012. PMID: 23127359 Free PMC article. Review.
-
S-nitrosylation: integrator of cardiovascular performance and oxygen delivery.J Clin Invest. 2013 Jan;123(1):101-10. doi: 10.1172/JCI62854. Epub 2013 Jan 2. J Clin Invest. 2013. PMID: 23281416 Free PMC article. Review.
References
-
- Marletta MA, Hurshman AR, Rusche KM. Catalysis by nitric oxide synthase. Curr Opin Chem Biol. 1998;2:656–663. - PubMed
-
- Aktan F. iNOS-mediated nitric oxide production and its regulation. Life Sci. 2004;75:639–653. - PubMed
-
- Derbyshire ER, Marletta MA. Biochemistry of soluble guanylate cyclase. Handb Exp Pharmacol. 2009:17–31. - PubMed
Publication types
MeSH terms
Substances
Grants and funding
LinkOut - more resources
Full Text Sources
