. 2012 Feb 14;28(6):3227-38.
doi: 10.1021/la205002f. Epub 2012 Feb 3.

Acentric 2-D ensembles of D-br-A electron-transfer chromophores via vectorial orientation within amphiphilic n-helix bundle peptides for photovoltaic device applications

Affiliations

Acentric 2-D ensembles of D-br-A electron-transfer chromophores via vectorial orientation within amphiphilic n-helix bundle peptides for photovoltaic device applications

Jaseung Koo et al. Langmuir. .

Abstract

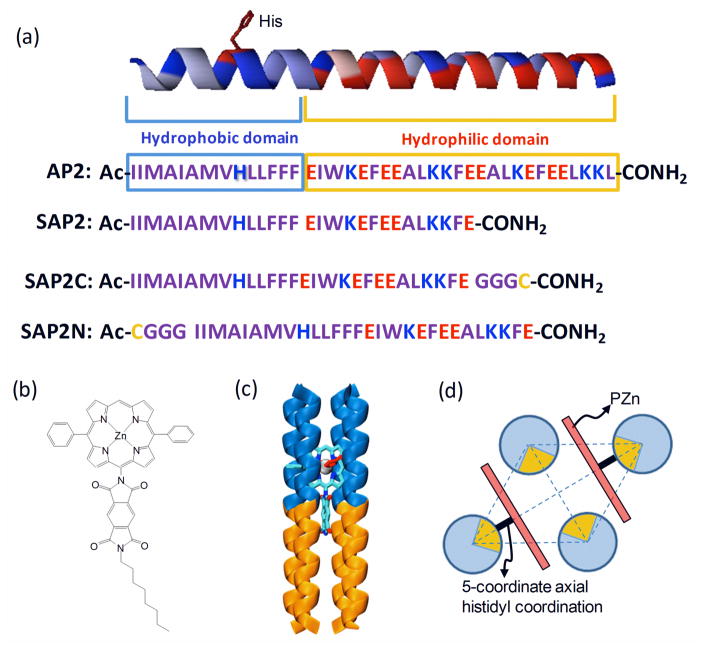
We show that simply designed amphiphilic 4-helix bundle peptides can be utilized to vectorially orient a linearly extended donor-bridge-acceptor (D-br-A) electron transfer (ET) chromophore within its core. The bundle's interior is shown to provide a unique solvation environment for the D-br-A assembly not accessible in conventional solvents and thereby control the magnitudes of both light-induced ET and thermal charge recombination rate constants. The amphiphilicity of the bundle's exterior was employed to vectorially orient the peptide-chromophore complex at a liquid-gas interface, and its ends were tailored for subsequent covalent attachment to an inorganic surface, via a "directed assembly" approach. Structural data, combined with evaluation of the excited state dynamics exhibited by these peptide-chromophore complexes, demonstrate that densely packed, acentrically ordered 2-D monolayer ensembles of such complexes at high in-plane chromophore densities approaching 1/200 Å(2) offer unique potential as active layers in binary heterojunction photovoltaic devices.


Figures

Figure 1
Figure 1
Titration of SAP2C (a) and SAP2N (b) with a 3μM solution of PZnPI in 50 mM KPi buffer with 2.2 wt% OG at pH 8 and 20°C. The spectra were recorded in a 1cm path length cuvette, containing 0, 0.5, 1, 2, 4, 6, 8 equiv added peptide monomer per chromophore. Expanded UV-vis absorption spectral views (Soret region, 350–500 nm) for SAP2C-PZnPI (c) and SAP2N-PZnPI (d) complexes. Further expanded UV-vis absorption spectral views (Soret region, 400–450 nm) for SAP2C-PZnPI (e) and SAP2N-PZnPI (f) complexes at chromophore/peptide helix mole ratios of 1:2 and 1:4. Soret peak positions determined by Gaussian fitting vs [SAP2C helix]/[PZnPI] mole ratio for SAP2C-PZnPI (g) and SAP2N-PZnPI (h) complexes.
Figure 2
Figure 2
Surface pressure-area (π-A) isotherms recorded for SAP2 in the apo-form (continuous) and with PZnPI at a chromophore/peptide helix mole ratio of 1:4 (dotted) spread from aqueous solution (50 mM phosphate buffer) with 2.2 wt% OG detergent on a subphase of 50 mM phosphate buffer at pH 8 and 20°C.
Figure 3
Figure 3
Experimental Fresnel-normalized x-ray reflectivity data (open symbols) compared with that calculated for the monolayer electron density profiles (solid curves) derived from the boxrefinement analysis as a function of photon momentum transfer qz for Langmuir monolayers of the SAP2 (at various surface pressures) (a) and of the SAP2C (at the higher surface pressure extreme) (c) at the water-air interface. The derived electron density profiles are shown for Langmuir monolayers of the SAP2 (b) and SAP2C (d).
Figure 4
Figure 4
Fresnel-normalized x-ray reflectivity data (circles) obtained via the interferometric approach for (i) a Si-Ni-Si multilayer reference structure with SAM and linker and (ii) the overlying SAP2C monolayer covalently attached to the surface of the Si-Ni-Si multilayer structure; (a) shows these data on a linear ordinate scale while (b) utilizes a corresponding log scale. (c) Corresponding electron density profiles derived for the multilayer substrate-peptide overlayer system. (d) Difference between the electron density profile for the Si-Ni-Si reference structure itself and with the SAP2C monolayer overlying the Si-Ni-Si structure [i.e., profile for SAP2C on Si-Ni-Si] minus that for [Si-Ni-Si].
Figure 5
Figure 5
Linear UV-vis absorbance spectra of (a) SAP2C-PZnPI and (b) SAP2N-PZnPI monolayer films (holo-form) covalently attached to the surface of a fused silica substrate.
Figure 6
Figure 6
Fresnel-normalized x-ray reflectivity data (circles) and the best fits (solid curves) from the box-refinement analysis as a function of photon momentum transfer qz for (i) a Si-Ni-Si multilayer reference structure itself and (ii) (a) SAP2C and (b) SAP2N monolayers covalently attached to the surface of the Si-Ni-Si multilayer structure, followed by incubation in 30 μM solution of PZnPI solution in 2.2 wt% of OG overnight and subsequent rinsing. Corresponding electron density profiles for (i) the Si-Ni-Si multilayer reference structure and (ii) the PZnPI-bound holo- (c) SAP2C and (d) SAP2N monolayers, covalently attached to the surface of the respective alkylated Si-Ni-Si multilayer substrates.
Figure 7
Figure 7
Difference between the electron density profile for the Si-Ni-Si reference structure and peptide/chromophore monolayer (holo form) on the Si-Ni-Si structure shown in Figure 6: (a) [SAP2C/PZnPI on Si-Ni-Si profile] minus [Si-Ni-Si profile] and (b) [SAP2N-PZnPI on Si-Ni-Si profile] minus [Si-Ni-Si profile]. The red open rectangular box (dotted line) indicates the expected position of PZn moiety of the bound PZnPI chromophore. Highly schematic representations of the SAP2C-PZnPI & SAP2N-PZnPI complexes (holo forms) covalently attached to a Si-Ni-Si surface are juxtaposed immediately above the profiles approximately to scale. Expanded scale schematic illustrations of the holo 4-helix SAP2C and SAP2N bundles are also shown above these representations.
Figure 8
Figure 8
Transient absorption spectra of (a) the SAP2N-PZnPI peptide (chromophore/peptide helix mole ratio of 1:4 in 50 mM phosphate buffer with 2.2 wt% OG, and (b) PZnPI in DMSO solvent, recorded at the labeled time delays. Experimental conditions: temperature = 20 °C; (a) λex = 560 nm, (b) λex = 601 nm. Exemplary transient decay kinetics measured at 719 nm for the (c) SAP2N-PZnPI peptide (chromophore/peptide helix mole ratio of 1:4) and (d) PZnPI in DMSO solvent. Insets to panels (c) and (d) display summaries of the respective proposed ET dynamics determined from global fitting of transient data acquired over the vis-NIR spectral domain (SAP2N-PZnPI: τCS = 300 fs, τCR = 78 ps; PZnPI in DMSO: τCS = 1.2 ps, τCR = 4.6 ps).
Scheme 1
Scheme 1
(a) Amino acid sequences (one-letter symbol) for AP2, SAP2, SAP2C and SAP2N. (b) Chemical structure of the PZnPI chromophore. (c) Schematic illustration of the SAP2-PZnPI complex (the blue and yellow regions represent the hydrophobic and hydrophilic domains, respectively). (d) Schematic illustration of a rhombic arrangement of the four helices in the plane perpendicular to the bundle axis with resulting chromophore/4-helix bundle mole ratio of 2:1.

References

    1. Marcus RA. Biochem Biophys Acta. 1985;811:265.
    1. Closs GL, Miller JR. Science. 1988;240:440. - PubMed
    1. Wasielewski MR. Chem Rev. 1992;92:435.
    1. Marcus RA. Rev Mod Phys. 1993;65:599.
    1. Paddon-Row MN. Acc Chem Res. 1994;27:18. - PubMed

Publication types