. 2012 Jan 12;73(1):49-63.
doi: 10.1016/j.neuron.2011.10.029.

Otic mesenchyme cells regulate spiral ganglion axon fasciculation through a Pou3f4/EphA4 signaling pathway

Affiliations

Otic mesenchyme cells regulate spiral ganglion axon fasciculation through a Pou3f4/EphA4 signaling pathway

Thomas M Coate et al. Neuron. .

Abstract

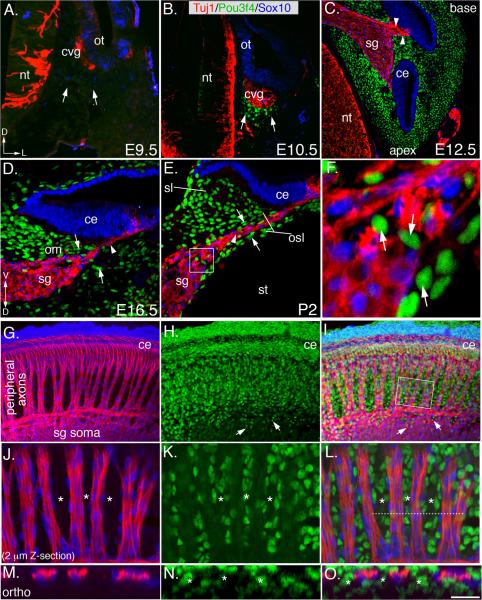
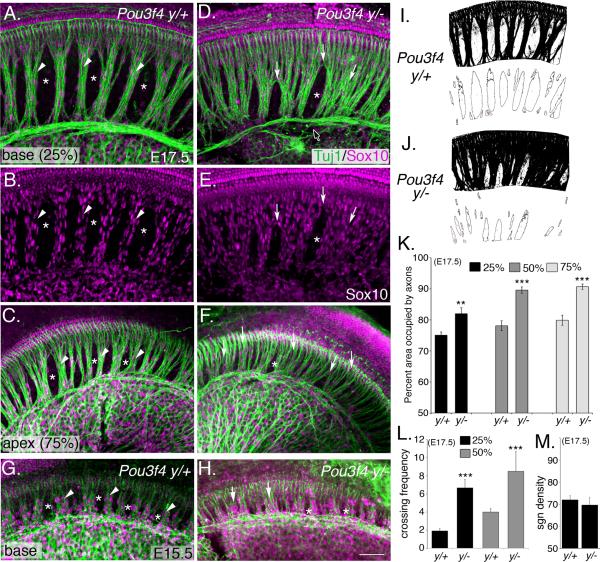
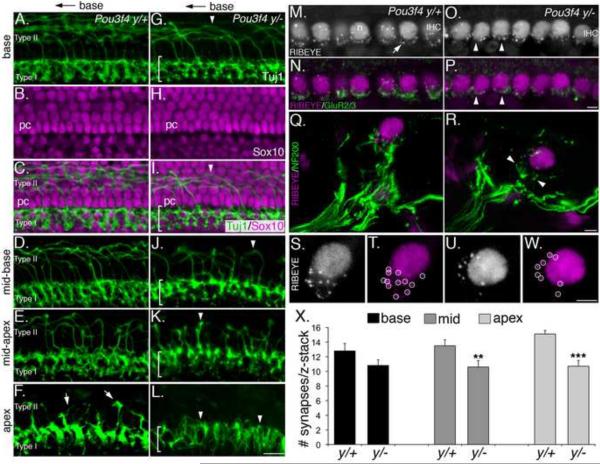
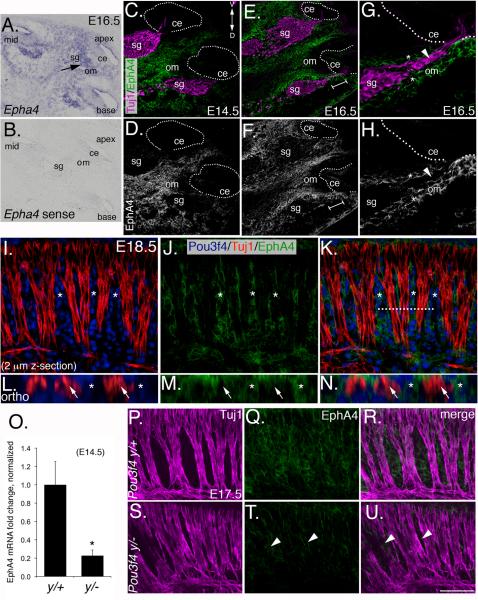
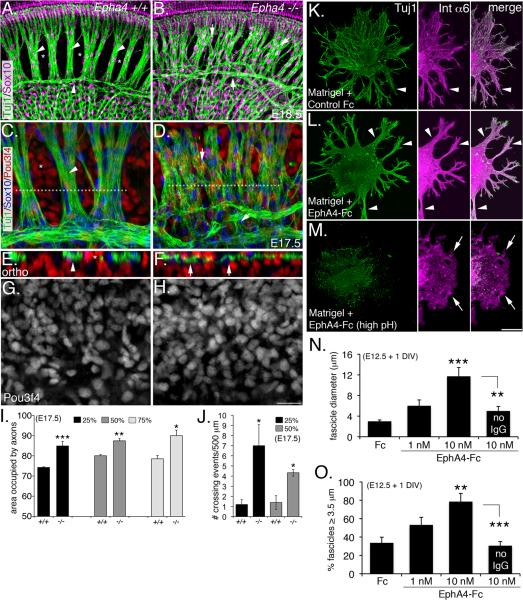
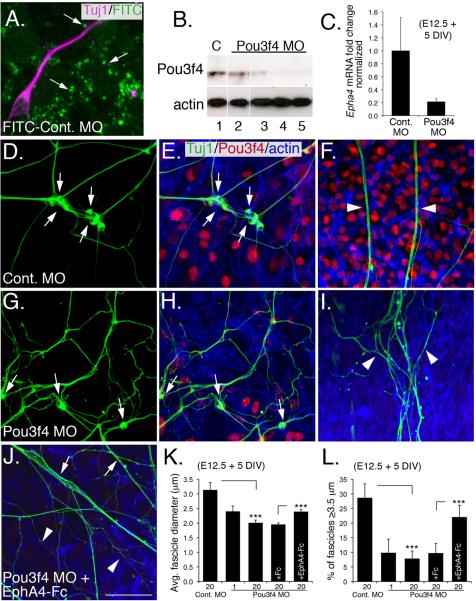
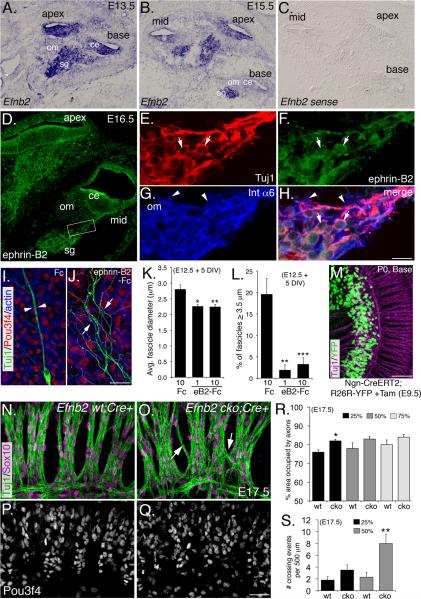
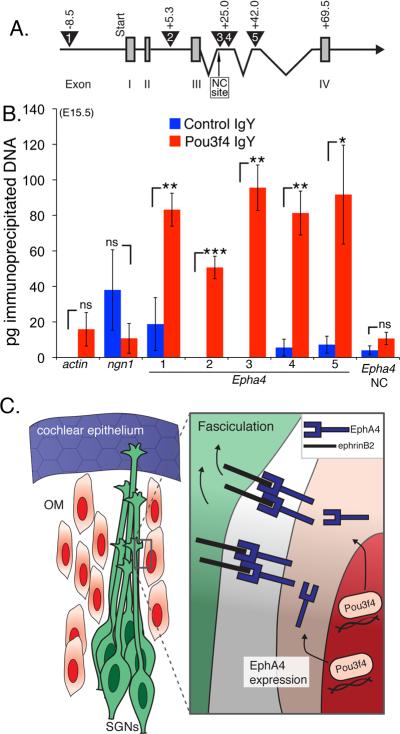
Peripheral axons from auditory spiral ganglion neurons (SGNs) form an elaborate series of radially and spirally oriented projections that interpret complex aspects of the auditory environment. However, the developmental processes that shape these axon tracts are largely unknown. Radial bundles are comprised of dense SGN fascicles that project through otic mesenchyme to form synapses within the cochlea. Here, we show that radial bundle fasciculation and synapse formation are disrupted when Pou3f4 (DFNX2) is deleted from otic mesenchyme. Further, we demonstrate that Pou3f4 binds to and directly regulates expression of Epha4, Epha4⁻/⁻ mice present similar SGN defects, and exogenous EphA4 promotes SGN fasciculation in the absence of Pou3f4. Finally, Efnb2 deletion in SGNs leads to similar fasciculation defects, suggesting that ephrin-B2/EphA4 interactions are critical during this process. These results indicate a model whereby Pou3f4 in the otic mesenchyme establishes an Eph/ephrin-mediated fasciculation signal that promotes inner radial bundle formation.


Figures

Figure 1
Figure 1. Pou3f4 expression during SGN development in mouse
(A) At E9.5, there is no Pou3f4 expression in the presumptive otic mesenchyme (arrows). nt: neural tube; ot: otocyst; cvg: cochleovestibular ganglion; D: dorsal; L: lateral. (B) At E10.5, Pou3f4 expression commences in the otic mesenchyme (arrows). (C) E12.5. At this stage, SGN peripheral axon outgrowth has started (arrowheads) and Pou3f4 protein is expressed by all mesenchyme cells in the otic capsule. sg: spiral ganglion; ce: cochlear epithelium. (D) Mid-modiolar cross section at E16.5. SGNs peripheral axons (arrowhead) project through otic mesenchyme (arrows) to reach the cochlear epithelium. om: otic mesenchyme. V: ventral. (E) At P2, SGNs and glia (arrowhead) are clearly separated from the surrounding mesenchyme (arrows). st: scalia tympani; osl: osseous spiral lamina; sl: spiral limbus. (F) High-magnification image from the boxed region in E. Pou3f4-positive cells (arrows) within the ganglion do not express neuron or glia markers. (G–I) Whole-mount view of the spiral ganglion and otic mesenchyme at E17.5. Inner radial bundles extend through otic mesenchyme to the cochlear epithelium. Arrows in H and I point to mesenchyme cells analogous to those illustrated in F. (J–L) A 2 μm thick confocal Z-stack from the boxed region in I illustrates the separation of the axons of the radial bundles and the mesenchyme cells. Asterisks mark bands of mesenchyme. (M–O) An orthogonal projection derived from the region indicated by the dotted line in L. The asterisks delineate the bands of mesenchyme. Scale bar in O: approximately 150 μm for A–C and G–I; 50 μm for D–E; 10 μm for F; 30 μm for J–L; 20 μm for M–O.
Figure 2
Figure 2. Absence of Pou3f4 causes defects in fasciculation of inner radial bundles
(A–C) Representative images of the base (A) and apex (C) from a Pou3f4y/+cochlea at E17.5. Arrowheads point to appropriately formed inner radial bundles; asterisks label bands of otic mesenchyme cells. (D–F) Whole mount images as in A–C but from Pou3f4y/−. Arrows point to defasciculated axons. The black arrow (with white stroke) points to the intraganglionic spiral axon bundle (Simmons et al., 2011) that also shows fasciculation defects. As in F, glial cells display a similar ectopic pattern. (G) At E15.5, the inner radial bundles are apparent (arrowheads), as well as regions of mesenchyme (asterisks). (H) Pou3f4y/− cochlea at E15.5. Fasciculation defects are already evident. Scale bar: 50 μm. (I–J) Illustration of the scheme by which the radial bundle phenotype was quantified. (K and L) Histograms illustrating significant increases in axon fasciculation defects (K) and the number of times per 500 μm that individual processes cross between fascicles (L) in Pou3f4y/− cochleae. Percentages indicate the position along the length of the cochlea with respect to the distance from the base. **P ≤ 0.01; ***P ≤ 0.001. (M) The density of neurons along the length of the cochlea is unchanged between Pou3f4y/+ and Pou3f4y/− mice. K–M: mean +/− SEM. Scale bar: 50 −m.
Figure 3
Figure 3. Defects in fasciculation in Pou3f4y/− mice impair innervation and synapse formation
(A–L) Type I and Type II projections in Pou3f4y/+ and Pou3f4y/− embryos at E17.5. Only the distal 10 μm of the type I fibers are shown. Scale bar in L = 50 μm (A–C) At the base of the cochlea, Type I fibers innervate the inner hair cell layer, while Type II fibers cross the pillar cell layer (shown in A and C) and then turn towards the base. (D–F) Illustration of the base-to-apex gradient of maturation of type II fibers. At E17.5, Type II projections are abundant in the mid-base, sparse in the mid-apex, and short at the apex (arrows). (G–I) In Pou3f4y/− embryos at E17.5, the Type I layer is less dense (see bracketed region), and there are fewer Type II projections (arrowhead). (J–L) Compared with wild-type, Pou3f4y/− embryos show fewer, less mature Type II projections. At the apex (L), no Type II projections are observed. Scale bar = 40 μm. (M–P) Whole-mount preparation of the apex of Pou3f4y/+ and Pou3f4y/− cochleae at P8. Anti-Ribeye immunostaining indicates ribbon synapses (see arrow in M). This antibody also recognizes CtBp2 (in all hair cell nuclei; n). IHC: inner hair cell. Anti-GluR2/3 (as in N) indicates post-synaptic glutamate receptors. Immunostaining for both factors in the mutant appears reduced (arrowheads). (Q and R) Mid-modiolar cross-sections of the inner hair cell region from Pou3f4 y/+ (Q) and Pou3f4y/− (R) cochleae at E17.5. Nerve terminals are marked by anti-neurofilament (200 kDa). Note the decreased density of nerve fibers contacting the inner hair cell in Pou3f4y/−(arrowheads). (S and T) A high-magnification view of the synaptic region from the inner hair cell in Q. Punctate spots (circled in T) represent individual ribbon synapses. (U and W) Similar view as in S,T but from the Pou3f4y/− inner hair cell in R. Note the decreased number of ribbon puncta. Scale bar = 4 μm. (X) Histogram indicating a significant decrease in the number of inner hair cell synapses (mean +/− SEM) in Pou3f4y/− cochleae at P8. **P ≤ 0.01; ***P ≤ 0.001.
Figure 4
Figure 4. EphA4 is expressed in the otic mesenchyme during development and is decreased in Pou3f4y/− embryos
(A and B) Epha4in situ hybridization in the E16.5 cochlea. (A) Antisense and (B) sense. Sg, spiral ganglion; om, otic mesenchyme; ce, cochlear epithelium. (C and D) EphA4 immunostaining at E14.5 Note the absence of EphA4 in all tissues except the otic mesenchyme. The dotted line delineates the cochlear epithelia. D: dorsal; V: ventral. (E–H) EphA4 immunostaining at E16.5. G and H are a high magnification view from the bracketed region of E and F. Note the “guide rails” marked by the asterisks, and the absence of EphA4 staining in the SGN axons (arrowheads). (I–K) Whole-mount preparation of a cochlea at E18.5. EphA4 expression is restricted to the mesenchyme (asterisks). (L–N) Orthogonal confocal reconstructions from the dotted line in K. (O) Quantitative PCR data showing that Epha4 expression levels are reduced approximately 5-fold in otic mesenchyme from Pou3f4y/− embryos (mean +/− SEM). *P ≤ 0.05. (P–U). EphA4 expression in wild-type and Pou3f4y/− embryos (where it is reduced; see arrowheads) in whole-mount at E17.5. Scale bar: 120 μm for A and B; 100 μM for C–F; 50 μm for G–K; 15 μm for L–N; 70 μm for P–U.
Figure 5
Figure 5. Epha4/EphA4 promotes SGN fasciculation and hair cell innervation
(A and B) Wild-type (A) and Epha4−/− cochleae (B) at E18.5. Arrowheads in A point to well-defined SGN fascicles and asterisks mark normally formed bands of mesenchyme. In contrast, there is less SGN fasciculation and axons inappropriately traversing the mesenchyme (arrows) in the Epha4−/− cochlea (B). (C and D) High-magnification views of wild-type (C) and Epha4−/− cochleae at E17.5 illustrating how the SGNs fail to bundle. (E and F) Orthogonal reconstructions from the regions marked by dotted lines in C and D showing the SGN bundles and mesenchyme are no longer segregated. (G and H) Monochrome images indicating no change in Pou3f4 expression in Epha4−/− cochleae. (I and J) Histograms illustrating the axon fasciculation defects (I) and the number of times per 500 μm that individual processes crossed between fascicles (J). Percentages indicate the position along the length cochlea with respect to the distance from the base. **P ≤ 0.01; ***P ≤ 0.001. (K and L) E12.5 SGN explants cultured for 24 hours in the presence of Matrigel + Fc control or + EphA4-Fc (both preclustered forms). The middle panels show the auditory glia (Int a6 positive). (M) Same as L, but the neurons were eliminated using high pH culture medium. (N and O) Histograms showing increased fascicle diameter (N) and percentage of “large” (≥ 3.5 μm) fascicles in response to EphA4-Fc.**P ≤ 0.01; ***P ≤ 0.001. Scale bars: In H, 50 μm for A and B, 20 μm for B–G; in M, 100 μm for K–M. DIV: days in vitro. I,J,N and O, mean +/− SEM.
Figure 6
Figure 6. Exogenous EphA4 protein rescues Pou3f4-dependent fasciculation defects in vitro
(A) Co-culture of SGNs (magenta) and mesenchyme cells. Punctate FITC-labeling indicates uptake of FITC-conjugated control MO by endocytic vesicles. (B) Western blot demonstrating knockdown of endogenous Pou3f4 by a Pou3f4 MO. Lane 1: 20 μM control MO; lane 2: 1 μM Pou3F4 MO; lanes 3–5: three different samples treated with 20 μM Pou3f4 MO. Anti-β-actin, loading control. (C) Quantitative PCR demonstrates a 5-fold reduction of Epha4 transcripts in mesenchyme cells treated with the Pou3f4 MO. DIV: days in vitro. (D–J) SGN/otic mesenchyme co-cultures treated with indicated MO. Green: anti-Tuj1 (neurons); red: anti-Pou3f4; blue: phalloidin (actin). (D–F) In the presence of 20 μM control MO, SGN cell bodies cluster (arrows in D,E) and have axons that form thick, straight fascicles that extend away from the cell bodies (arrowheads in F). (G–I) Treatment with 20 μM Pou3f4 MO decreases clustering of cell bodies (arrows in G,H), as well as decreased axon fasciculation (arrowheads in I). In addition, individual fibers follow more convoluted paths. Knock down of Pou3f4 is illustrated in (H). (J) Treatment with 20 μM Pou3f4 MO + 10 nM EphA4-Fc increases incidences of thick, straight fascicles (arrows) although single non-fasciculated neurites are still present (arrowheads). Scale bar: 20 μm for A; 40 μm for D–J. (K,L) Histograms illustrating changes in average fascicle diameter (μm) and average percentage of “large” ≥ 3.5 μm fascicles among the different treatment groups. ***P ≤ 0.001. C,K, and L, mean +/- SEM.
Figure 7
Figure 7. Ephrin-B2 acts as a cofactor for EphA4 during SGN fasciculation
(A–C) Efnb2 in situ hybridization at E13.5 and E15.5. sg: spiral ganglion; ce: cochlear epithelium; om: otic mesenchyme. (D) Ephrin-B2 antibody staining of the cochlea at E16.5. (E–H) High magnification view from the boxed region in D. (E) SGNs. (F) Ephrin-B2 expression primarily in the neurons (see arrows). (G) Glial cells (see arrowheads). (H) Merge. (I and J) Representative control Fc and ephrin-B2-Fc-treated samples from SGN/otic mesenchyme cultures. See text for details. (K and L) Histograms showing decreased average fascicle diameter (K) and percentage of “large” fascicles (L) in the presence of blocking ephrin-B2-Fc. DIV: days in vitro. (M) Tamoxifen induction of Ngn-CreERT2 induces expression of YFP reporter activity in ~95–100% of SGNs (see Experimental Procedures). (N) Micrograph showing morphology of the radial bundles in a control Efnb2 wt; Cre+ cochlea. (O) Micrograph showing less fasciculation and processes crossing between bundles (arrows) in Efnb2 cko; Cre+ cochlea. (P and Q) Pou3f4 staining shows that mesenchyme is normal in both wt and Efnb2 cko cochleae. (R and S) Histograms illustrating axon fasciculation defects (R) and the number of times per 500 μm that individual processes crossed between fascicles (S). Percentages indicate the position along the length cochlea with respect to the distance from the base. *P ≤ 0.05; **P ≤ 0.01. Scale bars: in H, 200 μm for A–C, 100 μm for D, 20 μm for E–H; in J 40 μm for I and J; in M, 80 μm; in R, 40 μm. K,L,R and S, mean +/- SEM.
Figure 8
Figure 8. Pou3f4 protein associates with Epha4 regulatory elements
(A) A cartoon schematic of Epha4 showing the first four of 16 exons. Exons I–IV (numbered gray boxes). The numbered triangles indicate the regions containing the putative Pou3f4 binding site ATTATTA. Primer sets were designed to amplify these five regions after ChIP. The negative control site, “NC site.” (B) Histogram showing the number of picograms (pg) of immunoprecipitated chomatin for each primer set. ns = not significant. *P ≤ 0.05; **P ≤ 0.01; ***P ≤ 0.001. Mean +/- SEM. (C) Cartoon schematic of a proposed model. Pou3f4 in otic mesenchyme induces expression of Epha4/EphA4, which binds to ephrin-B2 on developing SGN axons leading to fasciculation. As a result, SGN axons fasciculate to give rise to the inner radial bundles.

References

    1. Ahn KJ, Passero F, Jr., Crenshaw EB., 3rd Otic mesenchyme expression of Cre recombinase directed by the inner ear enhancer of the Brn4/Pou3f4 gene. Genesis. 2009;47:137–141. - PubMed
    1. Appler JM, Goodrich LV. Connecting the ear to the brain: Molecular mechanisms of auditory circuit assembly. Prog Neurobiol. 2011 - PMC - PubMed
    1. Baum PD, Garriga G. Neuronal migrations and axon fasciculation are disrupted in ina-1 integrin mutants. Neuron. 1997;19:51–62. - PubMed
    1. Bianchi LM, Gale NW. Distribution of Eph-related molecules in the developing and mature cochlea. Hear Res. 1998;117:161–172. - PubMed
    1. Bossing T, Brand AH. Dephrin, a transmembrane ephrin with a unique structure, prevents interneuronal axons from exiting the Drosophila embryonic CNS. Development. 2002;129:4205–4218. - PubMed

Publication types

MeSH terms