

Prematurity in mice leads to reduction in nephron number, hypertension, and proteinuria
- PMID: 22243792
- PMCID: PMC3896045
- DOI: 10.1016/j.trsl.2011.10.004
Prematurity in mice leads to reduction in nephron number, hypertension, and proteinuria
Abstract
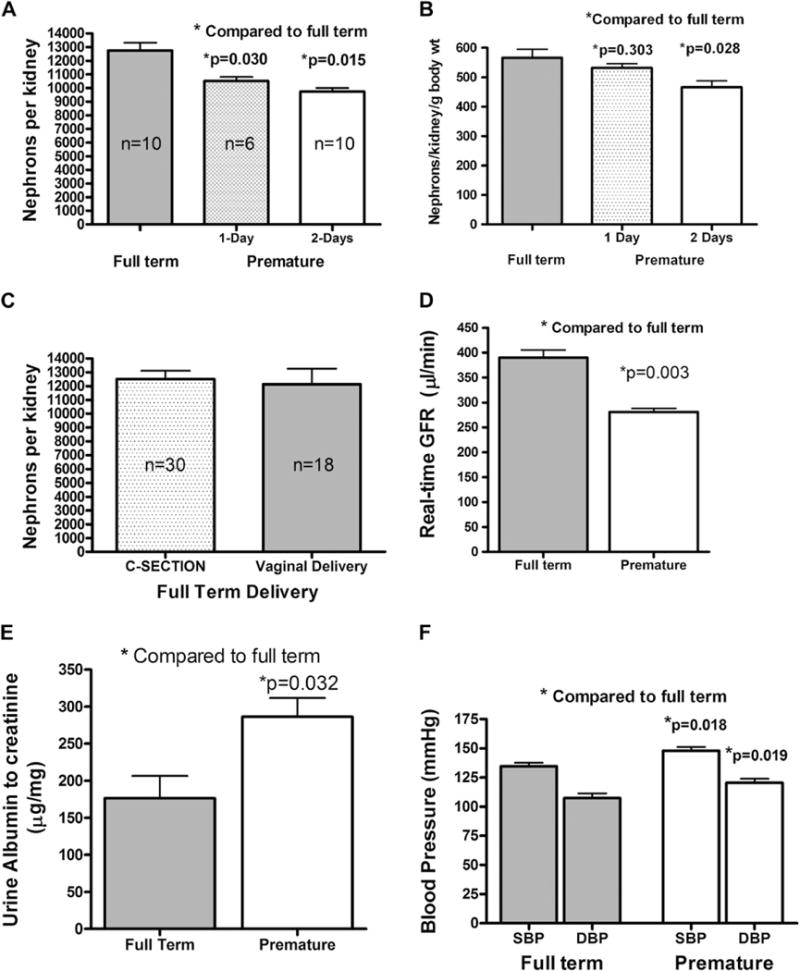
The nephron number at birth is a quantitative trait that correlates inversely with the risk of hypertension and chronic kidney disease later in life. During kidney development, the nephron number is controlled by multiple factors including genetic, epigenetic, and environmental modifiers. Premature birth, which represents more than 12% of annual live births in the United States, has been linked to low nephron number and the development of hypertension later in life. In this report, we describe the development of a mouse model of prematurity-induced reduction of nephron number. Premature mice, delivered 1 and 2 days early, have 17.4 ± 2.3% (n = 6) and 23.6 ± 2% (n = 10) fewer nephrons, respectively, when compared with full-term animals (12,252 ± 571 nephrons/kidney, n = 10). After 5 weeks of age, the mice delivered 2 days premature show lower real-time glomerular filtration rate (GFR, 283 ± 13 vs 389 ± 26 μL/min). The premature mice also develop hypertension (mean arterial pressure [MAP], 134 ± 18 vs 120 ± 14 mm Hg) and albuminuria (286 ± 83 vs 176 ± 59 μg albumin/mg creatinine). This mouse model provides a proof of concept that prematurity leads to reduced nephron number and hypertension, and this model will be useful in studying the pathophysiology of prematurity-induced nephron number reductions and hypertension.
Published by Mosby, Inc.
Figures
References
-
- Hamilton BE, Minino AM, Martin JA, et al. Annual summary of vital statistics. Pediatrics. 2005;2007(119):345–60. - PubMed
-
- Martin JA, Hamilton BE, Sutton PD, et al. National Vital Statistics Report. 2010.
-
- Centers for Disease Control and Prevention. National Vital Statistics Report. 58. 7-1-2008. Atlanta, Ga: Centers for Disease Control and Prevention; 2008.
-
- Kistner A, Celsi G, Vanpee M, Jacobson SH. Increased systolic daily ambulatory blood pressure in adult women born preterm. Pediatr Nephrol. 2005;20:232–3. - PubMed
-
- Kistner A, Celsi G, Vanpee M, Jacobson SH. Increased blood pressure but normal renal function in adult women born preterm. Pediatr Nephrol. 2000;15:215–20. - PubMed
Publication types
MeSH terms
Grants and funding
LinkOut - more resources
Full Text Sources
Medical
