

MIPHENO: data normalization for high throughput metabolite analysis
- PMID: 22244038
- PMCID: PMC3278354
- DOI: 10.1186/1471-2105-13-10
MIPHENO: data normalization for high throughput metabolite analysis
Abstract
Background: High throughput methodologies such as microarrays, mass spectrometry and plate-based small molecule screens are increasingly used to facilitate discoveries from gene function to drug candidate identification. These large-scale experiments are typically carried out over the course of months and years, often without the controls needed to compare directly across the dataset. Few methods are available to facilitate comparisons of high throughput metabolic data generated in batches where explicit in-group controls for normalization are lacking.
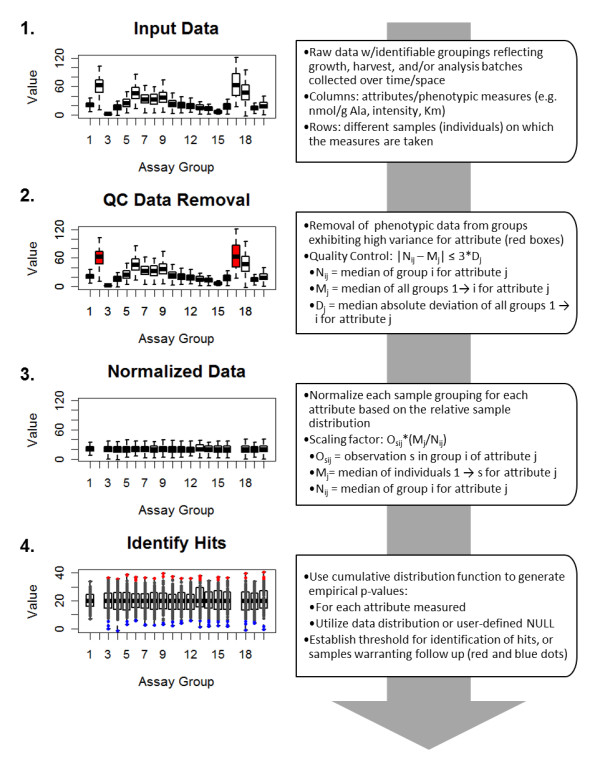
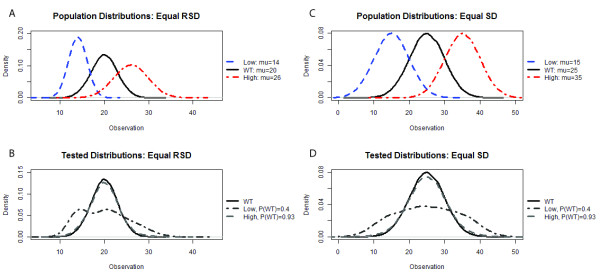
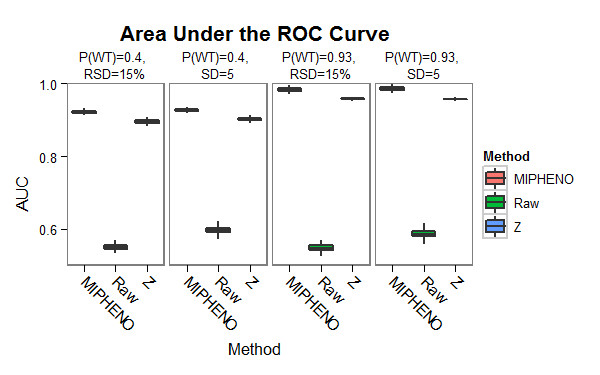
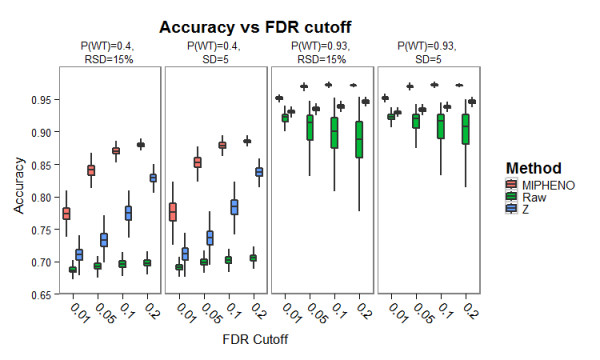
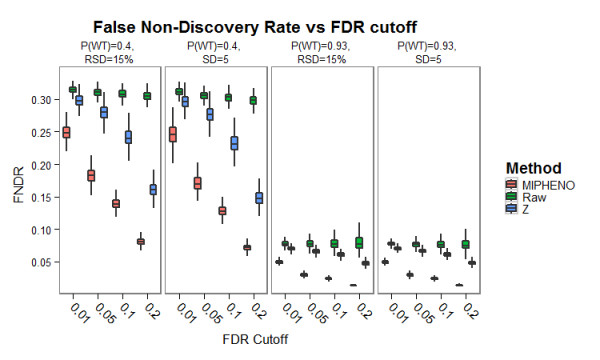
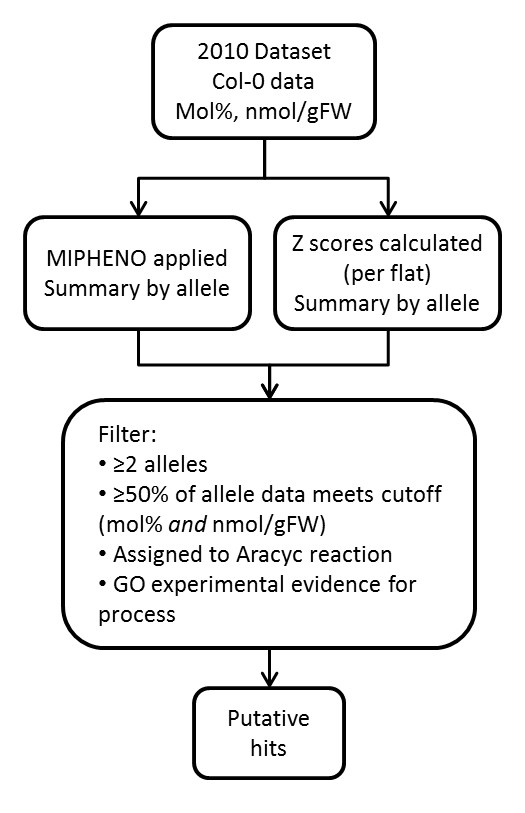
Results: Here we describe MIPHENO (Mutant Identification by Probabilistic High throughput-Enabled Normalization), an approach for post-hoc normalization of quantitative first-pass screening data in the absence of explicit in-group controls. This approach includes a quality control step and facilitates cross-experiment comparisons that decrease the false non-discovery rates, while maintaining the high accuracy needed to limit false positives in first-pass screening. Results from simulation show an improvement in both accuracy and false non-discovery rate over a range of population parameters (p < 2.2 × 10(-16)) and a modest but significant (p < 2.2 × 10(-16)) improvement in area under the receiver operator characteristic curve of 0.955 for MIPHENO vs 0.923 for a group-based statistic (z-score). Analysis of the high throughput phenotypic data from the Arabidopsis Chloroplast 2010 Project (http://www.plastid.msu.edu/) showed ~ 4-fold increase in the ability to detect previously described or expected phenotypes over the group based statistic.
Conclusions: Results demonstrate MIPHENO offers substantial benefit in improving the ability to detect putative mutant phenotypes from post-hoc analysis of large data sets. Additionally, it facilitates data interpretation and permits cross-dataset comparison where group-based controls are missing. MIPHENO is applicable to a wide range of high throughput screenings and the code is freely available as Additional file 1 as well as through an R package in CRAN.
Figures
Similar articles
-
New connections across pathways and cellular processes: industrialized mutant screening reveals novel associations between diverse phenotypes in Arabidopsis.Plant Physiol. 2008 Apr;146(4):1482-500. doi: 10.1104/pp.107.115220. Epub 2008 Feb 8. Plant Physiol. 2008. PMID: 18263779 Free PMC article.
-
Chloroplast phenomics: systematic phenotypic screening of chloroplast protein mutants in Arabidopsis.Methods Mol Biol. 2011;775:161-85. doi: 10.1007/978-1-61779-237-3_9. Methods Mol Biol. 2011. PMID: 21863443
-
Large-scale reverse genetics in Arabidopsis: case studies from the Chloroplast 2010 Project.Plant Physiol. 2010 Feb;152(2):529-40. doi: 10.1104/pp.109.148494. Epub 2009 Nov 11. Plant Physiol. 2010. PMID: 19906890 Free PMC article.
-
Using iterative cluster merging with improved gap statistics to perform online phenotype discovery in the context of high-throughput RNAi screens.BMC Bioinformatics. 2008 Jun 5;9:264. doi: 10.1186/1471-2105-9-264. BMC Bioinformatics. 2008. PMID: 18534020 Free PMC article.
-
Head-Group Acylation of Chloroplast Membrane Lipids.Molecules. 2021 Feb 26;26(5):1273. doi: 10.3390/molecules26051273. Molecules. 2021. PMID: 33652855 Free PMC article. Review.
Cited by
-
Analysis of Loss-of-Function Mutants in Aspartate Kinase and Homoserine Dehydrogenase Genes Points to Complexity in the Regulation of Aspartate-Derived Amino Acid Contents.Plant Physiol. 2015 Aug;168(4):1512-26. doi: 10.1104/pp.15.00364. Epub 2015 Jun 10. Plant Physiol. 2015. PMID: 26063505 Free PMC article.
-
BioHackathon 2015: Semantics of data for life sciences and reproducible research.F1000Res. 2020 Feb 24;9:136. doi: 10.12688/f1000research.18236.1. eCollection 2020. F1000Res. 2020. PMID: 32308977 Free PMC article.
-
Utility and Limitations of Using Gene Expression Data to Identify Functional Associations.PLoS Comput Biol. 2016 Dec 9;12(12):e1005244. doi: 10.1371/journal.pcbi.1005244. eCollection 2016 Dec. PLoS Comput Biol. 2016. PMID: 27935950 Free PMC article.
-
Integrated LC-MS/MS system for plant metabolomics.Comput Struct Biotechnol J. 2013 May 23;4:e201301011. doi: 10.5936/csbj.201301011. eCollection 2013. Comput Struct Biotechnol J. 2013. PMID: 24688692 Free PMC article. Review.
-
Functional Metabolomics Describes the Yeast Biosynthetic Regulome.Cell. 2016 Oct 6;167(2):553-565.e12. doi: 10.1016/j.cell.2016.09.007. Epub 2016 Sep 29. Cell. 2016. PMID: 27693354 Free PMC article.
References
Publication types
MeSH terms
Substances
LinkOut - more resources
Full Text Sources
