. 2012 Jan 16:13:11.
doi: 10.1186/1471-2105-13-11.

Convergent evolution in structural elements of proteins investigated using cross profile analysis

Affiliations

Convergent evolution in structural elements of proteins investigated using cross profile analysis

Kentaro Tomii et al. BMC Bioinformatics. .

Abstract

Background: Evolutionary relations of similar segments shared by different protein folds remain controversial, even though many examples of such segments have been found. To date, several methods such as those based on the results of structure comparisons, sequence-based classifications, and sequence-based profile-profile comparisons have been applied to identify such protein segments that possess local similarities in both sequence and structure across protein folds. However, to capture more precise sequence-structure relations, no method reported to date combines structure-based profiles, and sequence-based profiles based on evolutionary information. The former are generally regarded as representing the amino acid preferences at each position of a specific conformation of protein segment. They might reflect the nature of ancient short peptide ancestors, using the results of structural classifications of protein segments.

Results: This report describes the development and use of "Cross Profile Analysis" to compare sequence-based profiles and structure-based profiles based on amino acid occurrences at each position within a protein segment cluster. Using systematic cross profile analysis, we found structural clusters of 9-residue and 15-residue segments showing remarkably strong correlation with particular sequence profiles. These correlations reflect structural similarities among constituent segments of both sequence-based and structure-based profiles. We also report previously undetectable sequence-structure patterns that transcend protein family and fold boundaries, and present results of the conformational analysis of the deduced peptide of a segment cluster. These results suggest the existence of ancient short-peptide ancestors.

Conclusions: Cross profile analysis reveals the polyphyletic and convergent evolution of β-hairpin-like structures, which were verified both experimentally and computationally. The results presented here give us new insights into the evolution of short protein segments.


Figures

Figure 1
Figure 1
Schematic representation of cross profile analysis using FORTE.
Figure 2
Figure 2
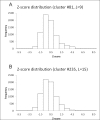
Z-score distributions in cross profile analysis. Two Z-score distributions of (A) cluster #81, as an example of for 9-residue-long segments, and (B) cluster #235, as an example of for 15-residue-long segments are shown.
Figure 3
Figure 3
Structures of the preserved segments in ferredoxin-like fold proteins. Three ferredoxin-like fold proteins are shown. The corresponding portions of (A) 1p1lA:2-16, (B) 1kr4A:7-21, and (C) 1mwqA:58-72 are in yellow.
Figure 4
Figure 4
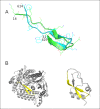
Structural superposition of the two preserved segments in two unrelated proteins with different folds. (A) Two β-hairpin-like segments of FLVC-segment (green) and BPTI-segment (blue) are superimposed (2.49Å Cα RMSD). (B) Different structures of 1jnrA (left) and 1kthA (right) are shown. The corresponding portion (yellow) of the two segments forms a β-hairpin-like structure in both proteins.
Figure 5
Figure 5
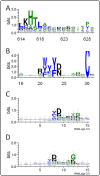
Graphical representation of sequence conservation patterns. Sequence conservation patterns of the corresponding regions of the profiles of (A) FLVC-segment, (B) BPTI-segment, (C) cluster #235, and (D) cluster #159 were drawn using WebLogo 3 [62].
Figure 6
Figure 6
Distribution of score differences between the ancestral and existing sequences. The score differences ΔS (deltaS) between the ancestral and existing sequences of two protein families are shown: ΔS of the PF02910 sequences for the structure-based profiles of clusters (A) #235 and (b) #159, and ΔS of the PF00014 sequences for the structure-based profiles of clusters (C) #235 and (d) #159.
Figure 7
Figure 7
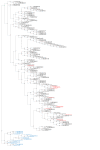
Phylogenetic tree of the PF02910 family sequences. The phylogenetic tree of 40% representatives of PF0291 and 1jnrA (= O28603_ARCFU/519-641) generated by ANCESCON is shown. Proteins with positive values of ΔS are shown in red. 22 sequences that were excluded from the calculation are shown in blue. The next root position regarded as an ancestral protein is shown in green.
Figure 8
Figure 8
Schematic representation of an evolutionary landscape of the segments. The contour map in a sequence space represents compatibility with the structure-based profile of the β-hairpin-like structure we identified. Points closer to the highest point (open circle) on the map are more compatible with the structure-based profile of cluster #159. Crosses and inclined crosses represent segments in presently existing proteins, which are classified respectively into two families, PF00014 and PF02910. Squares indicate ancestral sequences of each family, so that the map involves evolutionary directions of present segments from their ancestors. The sequence space in the map is defined by the PCA axes (PC1 and PC2). These axes were determined using principal component analysis (PCA) of sequences of all segments, in which the Hamming distance was used as a dissimilarity parameter between the two sequences. Contour levels shown with color scaling were drawn by the interpolation algorithm embedded in IGOR using the compatibility values S of both existing and virtual sequences.
Figure 9
Figure 9
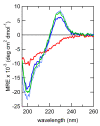
Far-UV CD spectra of the consensus peptide of cluster #159. CD spectra of the 15-residue peptide with the consensus amino acid sequence, TIIMWYYDPETGEWW, of cluster #159 are shown. The CD spectra of the peptide at 20°C (293 K, blue line) and 5°C (278 K, green line) are similar. Temperature-dependent spectra show thermal denaturation at 98°C (371 K, red line) and renaturation at 20°C (293 K, dotted blue line) after the temperature-jump from 98°C (371 K) of the peptide.

Similar articles

Cited by

References

    1. Lupas AN, Ponting CP, Russell RB. On the evolution of protein folds: are similar motifs in different protein folds the result of convergence, insertion, or relics of an ancient peptide world? J Struct Biol. 2001;134(2-3):191–203. doi: 10.1006/jsbi.2001.4393. - DOI - PubMed
    1. Gribskov M, McLachlan AD, Eisenberg D. Profile analysis: detection of distantly related proteins. Proc Natl Acad Sci USA. 1987;84(13):4355–4358. doi: 10.1073/pnas.84.13.4355. - DOI - PMC - PubMed
    1. Ohlson T, Wallner B, Elofsson A. Profile-profile methods provide improved fold-recognition: a study of different profile-profile alignment methods. Proteins. 2004;57(1):188–197. doi: 10.1002/prot.20184. - DOI - PubMed
    1. Rychlewski L, Jaroszewski L, Li W, Godzik A. Comparison of sequence profiles. Strategies for structural predictions using sequence information. Protein Sci. 2000;9(2):232–241. - PMC - PubMed
    1. Panchenko AR. Finding weak similarities between proteins by sequence profile comparison. Nucleic Acids Res. 2003;31(2):683–689. doi: 10.1093/nar/gkg154. - DOI - PMC - PubMed

LinkOut - more resources