

QTL/microarray approach using pathway information
- PMID: 22244197
- PMCID: PMC3340326
- DOI: 10.1186/1748-7188-7-1
QTL/microarray approach using pathway information
Abstract
Background: A combined quantitative trait loci (QTL) and microarray-based approach is commonly used to find differentially expressed genes which are then identified based on the known function of a gene in the biological process governing the trait of interest. However, a low cutoff value in individual gene analyses may result in many genes with moderate but meaningful changes in expression being missed.
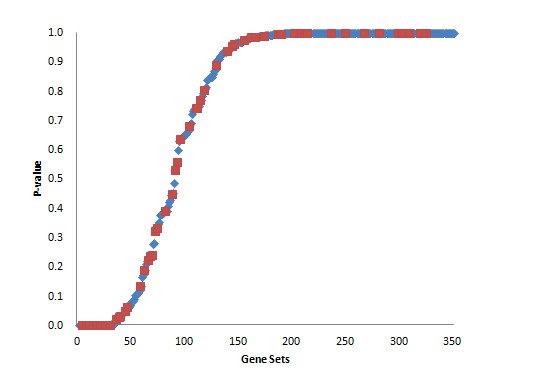
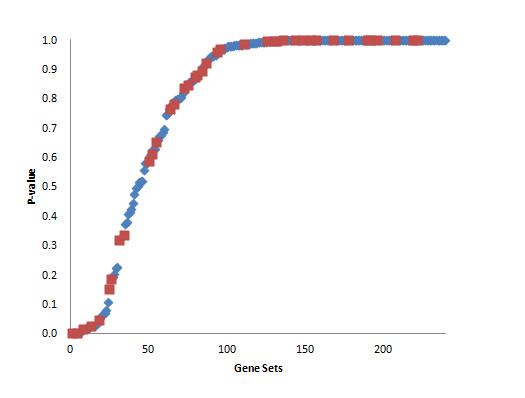
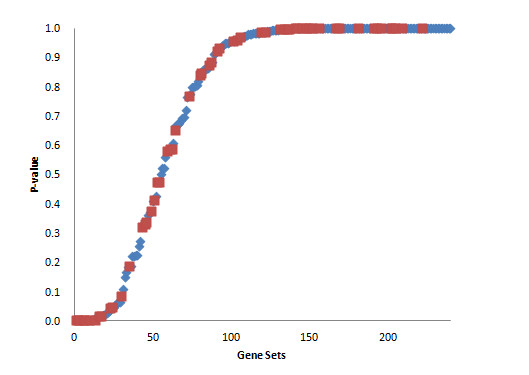
Results: We modified a gene set analysis to identify intersection sets with significantly affected expression for which the changes in the individual gene sets are less significant. The gene expression profiles in liver tissues of four strains of mice from publicly available microarray sources were analyzed to detect trait-associated pathways using information on the QTL regions of blood concentrations of high density lipoproteins (HDL) cholesterol and insulin-like growth factor 1 (IGF-1). Several metabolic pathways related to HDL levels, including lipid metabolism, ABC transporters and cytochrome P450 pathways were detected for HDL QTL regions. Most of the pathways identified for the IGF-1 phenotype were signal transduction pathways associated with biological processes for IGF-1's regulation.
Conclusion: We have developed a method of identifying pathways associated with a quantitative trait using information on QTL. Our approach provides insights into genotype-phenotype relations at the level of biological pathways which may help to elucidate the genetic architecture underlying variation in phenotypic traits.
Figures
References
LinkOut - more resources
Full Text Sources
Miscellaneous
