

Structural differences between soluble and membrane bound cytochrome P450s
- PMID: 22244217
- PMCID: PMC4190058
- DOI: 10.1016/j.jinorgbio.2011.11.026
Structural differences between soluble and membrane bound cytochrome P450s
Abstract
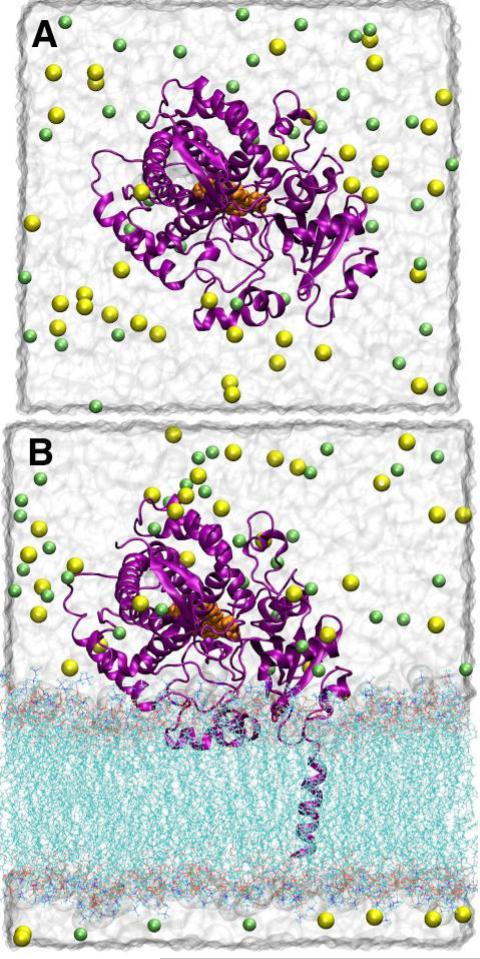
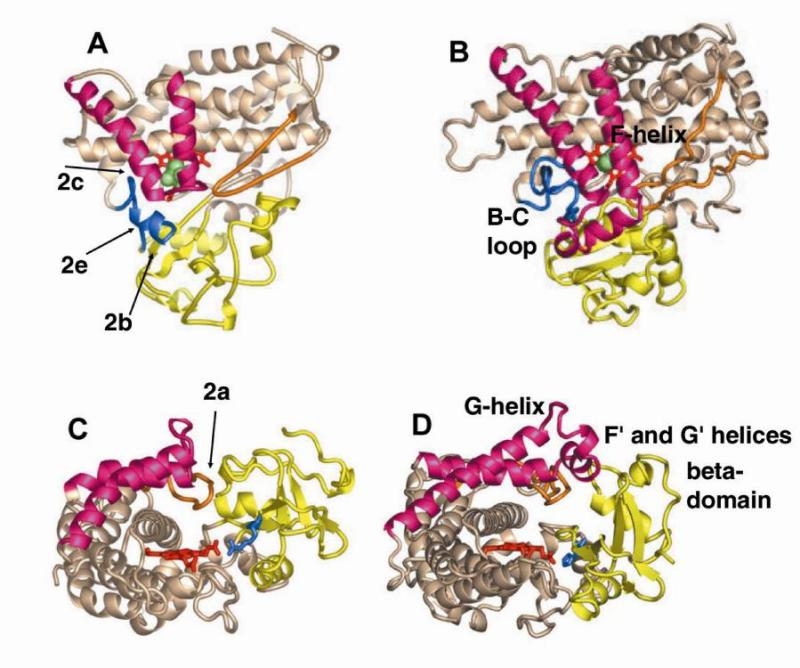
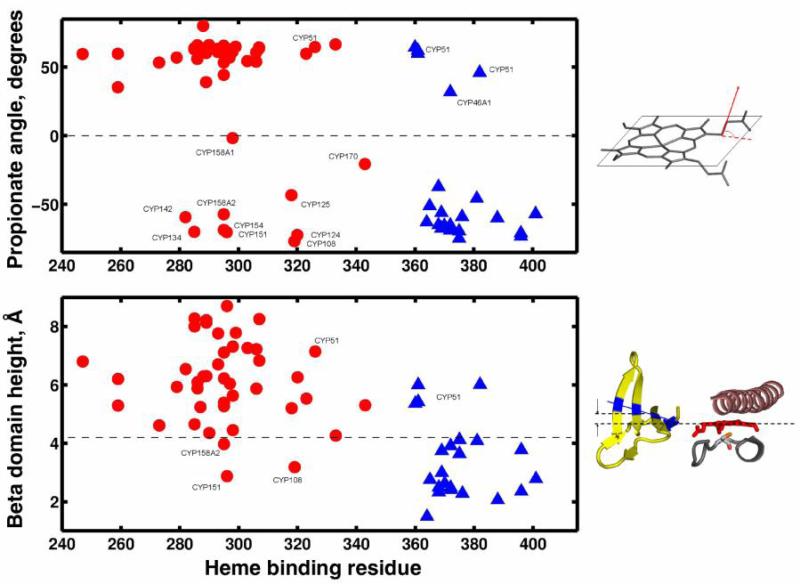
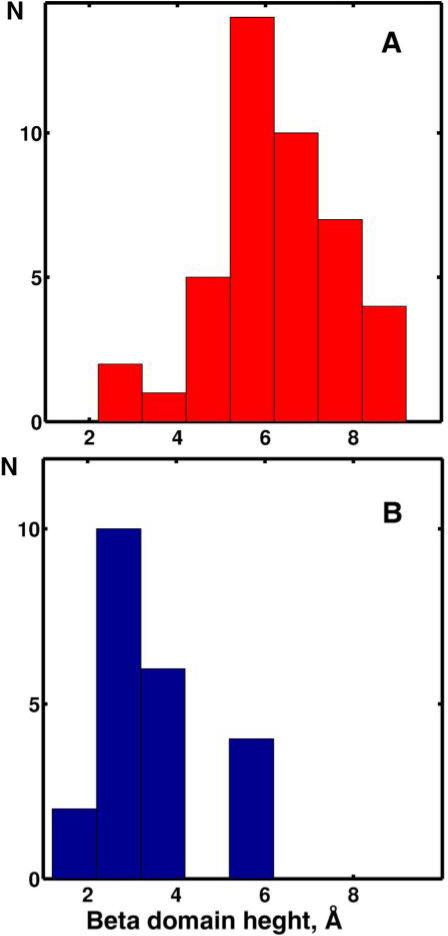
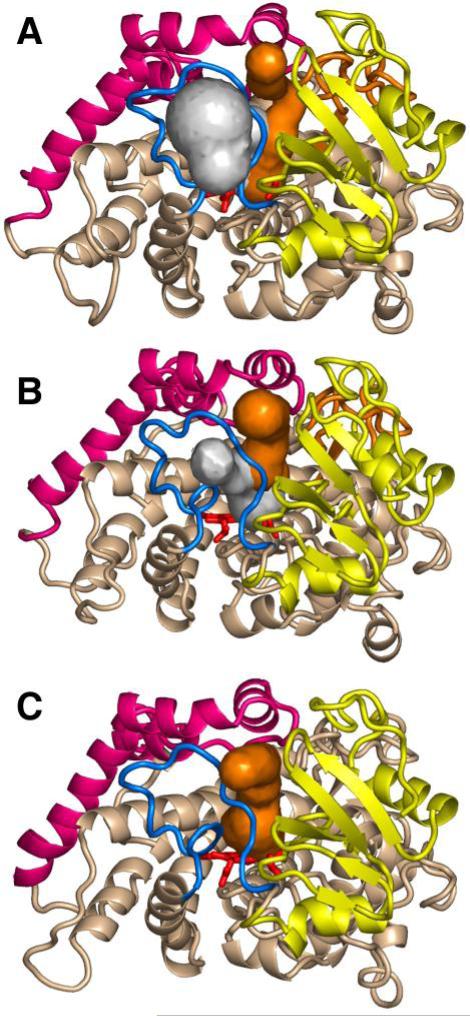
The superfamily of cytochrome P450s forms a large class of heme monooxygenases with more than 13,000 enzymes represented in organisms from all biological kingdoms. Despite impressive variability in sizes, sequences, location, and function, all cytochrome P450s from various organisms have very similar tertiary structures within the same fold. Here we show that systematic comparison of all available X-ray structures of cytochrome P450s reveals the presence of two distinct structural classes of cytochrome P450s. For all membrane bound enzymes, except the CYP51 family, the beta-domain and the A-propionate heme side chain are shifted towards the proximal side of the heme plane, which may result in an increase of the volume of the substrate binding pocket and an opening of a potential channel for the substrate access and/or product escape directly into the membrane. This structural feature is also observed in several soluble cytochrome P450s, such as CYP108, CYP151, and CYP158A2, which catalyze transformations of bulky substrates. Alternatively, both beta-domains and the A-propionate side chains in the soluble isozymes extend towards the distal site of the heme. This difference between the structures of soluble and membrane bound cytochrome P450s can be rationalized through the presence of several amino acid inserts in the latter class which are involved in direct interactions with the membrane, namely the F'- and G'-helices. Molecular dynamics using the most abundant human cytochrome P450, CYP3A4, incorporated into a model POPC bilayer reveals the facile conservation of a substrate access channel, directed into the membrane between the B-C loop and the beta domain, and the closure of the peripheral substrate access channel directed through the B-C loop. This is in contrast to the case when the same simulation is run in buffer, where no such channel closing occurs. Taken together, these results reveal a key structural difference between membrane bound and soluble cytochrome P450s with important functional implications induced by the lipid bilayer.
Copyright © 2011 Elsevier Inc. All rights reserved.
Figures
Similar articles
-
Structural basis of steroid binding and oxidation by the cytochrome P450 CYP109E1 from Bacillus megaterium.FEBS J. 2016 Nov;283(22):4128-4148. doi: 10.1111/febs.13911. Epub 2016 Oct 17. FEBS J. 2016. PMID: 27686671 Free PMC article.
-
Molecular dynamics simulations of P450 BM3--examination of substrate-induced conformational change.J Biomol Struct Dyn. 1999 Jun;16(6):1189-203. doi: 10.1080/07391102.1999.10508327. J Biomol Struct Dyn. 1999. PMID: 10447203
-
In silico analysis of cytochrome P450 monooxygenases in chronic granulomatous infectious fungus Sporothrix schenckii: Special focus on CYP51.Biochim Biophys Acta Proteins Proteom. 2018 Jan;1866(1):166-177. doi: 10.1016/j.bbapap.2017.10.003. Epub 2017 Oct 5. Biochim Biophys Acta Proteins Proteom. 2018. PMID: 28989052
-
P450BM-3; a tale of two domains--or is it three?Steroids. 1997 Jan;62(1):117-23. doi: 10.1016/s0039-128x(96)00169-9. Steroids. 1997. PMID: 9029725 Review.
-
Structural diversity of eukaryotic membrane cytochrome p450s.J Biol Chem. 2013 Jun 14;288(24):17082-90. doi: 10.1074/jbc.R113.452805. Epub 2013 Apr 30. J Biol Chem. 2013. PMID: 23632020 Free PMC article. Review.
Cited by
-
Lipid composition and macromolecular crowding effects on CYP2J2-mediated drug metabolism in nanodiscs.Protein Sci. 2019 May;28(5):928-940. doi: 10.1002/pro.3603. Epub 2019 Apr 1. Protein Sci. 2019. PMID: 30861250 Free PMC article.
-
CYP2J2 Molecular Recognition: A New Axis for Therapeutic Design.Pharmacol Ther. 2020 Nov;215:107601. doi: 10.1016/j.pharmthera.2020.107601. Epub 2020 Jun 11. Pharmacol Ther. 2020. PMID: 32534953 Free PMC article. Review.
-
Characterizing the membrane-bound state of cytochrome P450 3A4: structure, depth of insertion, and orientation.J Am Chem Soc. 2013 Jun 12;135(23):8542-51. doi: 10.1021/ja4003525. Epub 2013 May 30. J Am Chem Soc. 2013. PMID: 23697766 Free PMC article.
-
Substrate Dependent Native Luminescence from Cytochromes P450 3A4, 2C9, and P450cam.J Phys Chem B. 2016 Mar 31;120(12):3038-3047. doi: 10.1021/acs.jpcb.5b11804. Epub 2016 Mar 16. J Phys Chem B. 2016. PMID: 26939024 Free PMC article.
-
Cytochrome-P450-Induced Ordering of Microsomal Membranes Modulates Affinity for Drugs.Angew Chem Int Ed Engl. 2018 Mar 19;57(13):3391-3395. doi: 10.1002/anie.201713167. Epub 2018 Feb 22. Angew Chem Int Ed Engl. 2018. PMID: 29385304 Free PMC article.
References
-
- Nelson DR. Biochim. Biophys. Acta, Proteins Proteomics. 2011;1814:14–18. - PubMed
-
- Ortiz de Montellano PR. Cytochrome P450: Structure, Mechanism, and Biochemistry. Kluwer Academic/ Plenum Publishers; New York: 2005. p. 689.
-
- Poulos TL, Johnson EF. In: Cytochrome P450: Structure, Function, Genetics. Ortiz de Montellano PR, editor. Kluwer Academic/Plenum Publishers; New York: 2005. pp. 87–114.
-
- von Koenig K, Schlichting I. In: Ubiquitous Roles of Cytochrome P450 Proteins. Sigel A, Sigel H, Sigel RKO, editors. Wiley and Sons; 2007. pp. 235–265.
Publication types
MeSH terms
Substances
Grants and funding
LinkOut - more resources
Full Text Sources
Other Literature Sources
