. 2012 Jan 13:13:19.
doi: 10.1186/1471-2164-13-19.

Transcriptomic analysis of Chinese bayberry (Myrica rubra) fruit development and ripening using RNA-Seq

Affiliations

Transcriptomic analysis of Chinese bayberry (Myrica rubra) fruit development and ripening using RNA-Seq

Chao Feng et al. BMC Genomics. .

Abstract

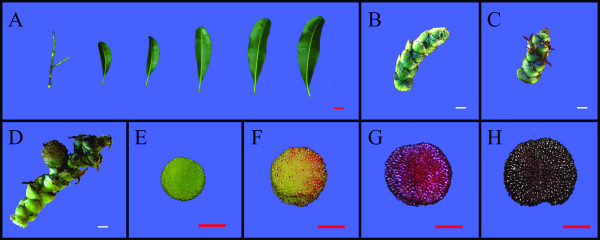
Background: Chinese bayberry (Myrica rubra Sieb. and Zucc.) is an important subtropical fruit crop and an ideal species for fruit quality research due to the rapid and substantial changes that occur during development and ripening, including changes in fruit color and taste. However, research at the molecular level is limited by a lack of sequence data. The present study was designed to obtain transcript sequence data and examine gene expression in bayberry developing fruit based on RNA-Seq and bioinformatic analysis, to provide a foundation for understanding the molecular mechanisms controlling fruit quality changes during ripening.

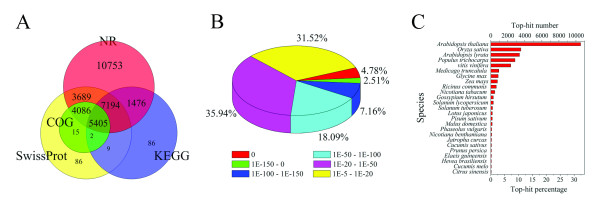
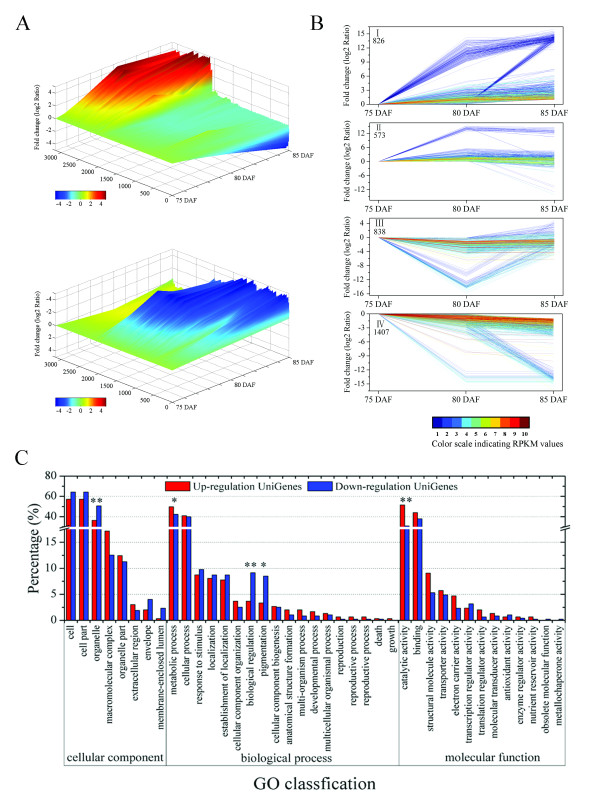
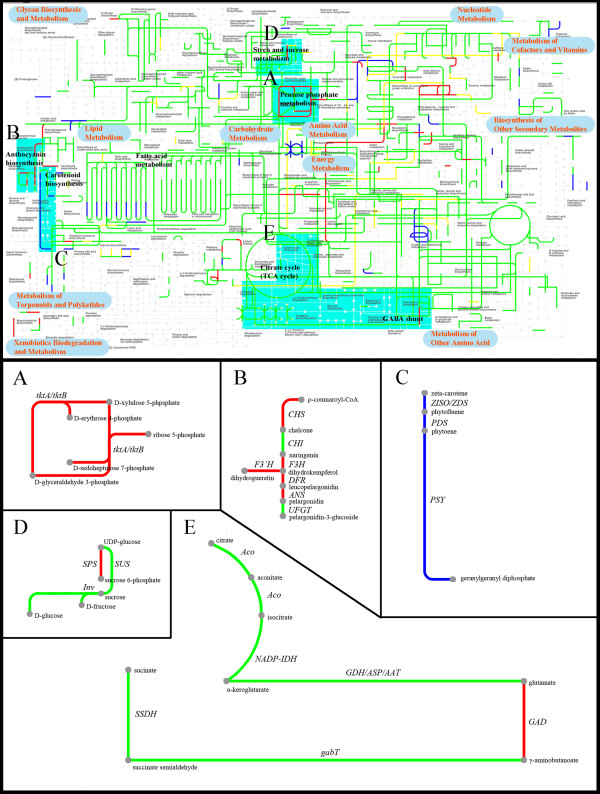
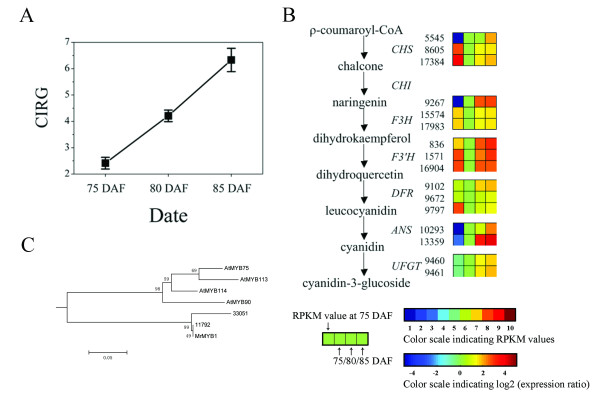
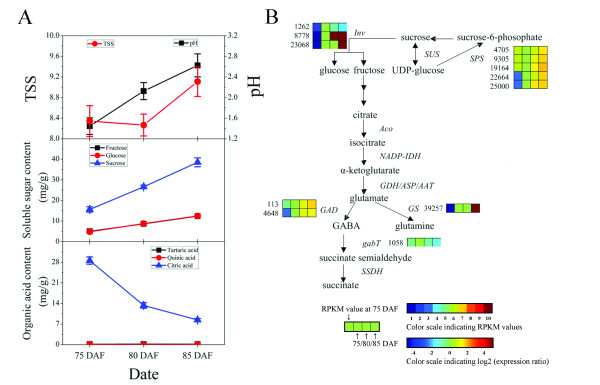
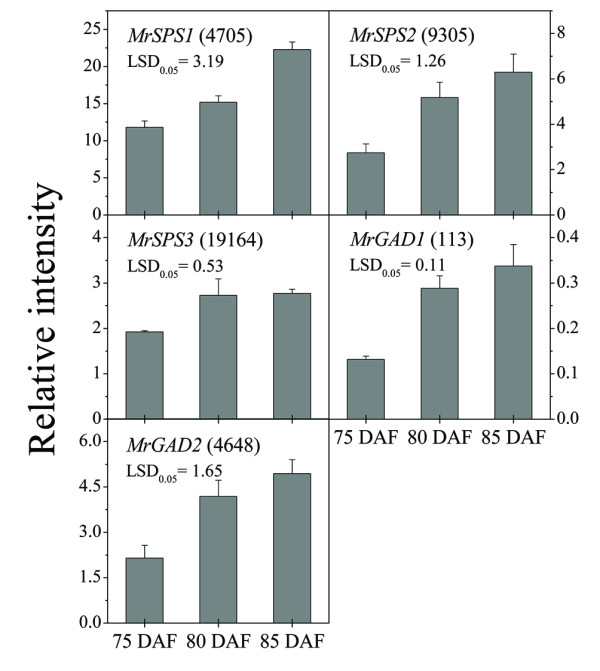
Results: RNA-Seq generated 1.92 G raw data, which was then de novo assembled into 41,239 UniGenes with a mean length of 531 bp. Approximately 80% of the UniGenes (32,805) were annotated against public protein databases, and coding sequences (CDS) of 31,665 UniGenes were determined. Over 3,600 UniGenes were differentially expressed during fruit ripening, with 826 up-regulated and 1,407 down-regulated. GO comparisons between the UniGenes of these two types and interactive pathways (Ipath) analysis found that energy-related metabolism was enhanced, and catalytic activity was increased. All genes involved in anthocyanin biosynthesis were up-regulated during the fruit ripening processes, concurrent with color change. Important changes in carbohydrate and acid metabolism in the ripening fruit are likely associated with expression of sucrose phosphate synthase (SPS) and glutamate decarboxylase (GAD).

Conclusions: Mass sequence data of Chinese bayberry was obtained and the expression profiles were examined during fruit ripening. The UniGenes were annotated, providing a platform for functional genomic research with this species. Using pathway mapping and expression profiles, the molecular mechanisms for changes in fruit color and taste during ripening were examined. This provides a reference for the study of complicated metabolism in non-model perennial species.


Figures

Figure 1
Figure 1
Tissues of Chinese bayberry cv. Biqi used in deep sequencing. (A) Stem and leaf, (B) Bud, (C) Flower, (D) young fruit at 15 DAF, (E) young fruit at 45 DAF, (F) breaker stage fruit at 75 DAF, (G) red ripe stage fruit at 80 DAF, (H) dark red ripe stage fruit at 85DAF. Red bar = 1 cm, white bar = 1 mm.
Figure 2
Figure 2
Characteristics of homology search of Chinese bayberry UniGenes. (A) Venn diagram of number of UniGenes annotated by BLASTx with an E-value threshold of 10-5 against protein databases. The numbers in the circles indicate the number of UniGenes annotated by single or multiple databases, (B) E-value distribution of the top BLASTx hits against the nr database for each UniGene, (C) Number and percentage of UniGenes matching the 25 top species using BLASTx in the nr database.
Figure 3
Figure 3
UniGene expression profiles during bayberry fruit ripening. (A) Overall expression profiles for the UniGenes expressed in fruit libraries of three different maturity stages, (B) Four expression profiles are shown, with I and IV indicating UniGenes with up-regulated and down-regulated expression, respectively, and II and III indicating those with irregular expression. The lines with 10 different colors from blue to red show the absolute expression magnitude at 75 DAF, with the RPKM values 0-10, 10-20, 20-40, 40-80, 80-160, 160-320, 320-640, 640-1280, 1280-2560, and over 2560 represented by colors 1 to 10, respectively, (C) GO classification for up-regulated and down-regulated UniGenes, with * and ** indicating significant difference at 5% and 1%, respectively.
Figure 4
Figure 4
Interactive pathways analysis during bayberry fruit ripening. The green, the red, the blue and the yellow lines indicate genes with non-significant expression change, up-regulated, down-regulated, and irregularly regulated, respectively. The areas with sky blue background indicate the metabolic pathways related to fruit color, sugar and organic acids. (A) Pentose phosphate metabolism, (B) Anthocyanin biosynthesis, (C) The upstream part of carotenoid biosynthesis, (D) Sucrose biosynthesis, (E) GABA shunt.
Figure 5
Figure 5
Schematic of physiological and metabolic data related to bayberry fruit color during ripening. (A) Changes in CIRG values during fruit ripening, (B) anthocyanin biosynthesis pathway. Enzyme names, UniGene ids and expression patterns are indicated on the right of each step. The expression patterns of each UniGenes are shown by 4 grids, with the left one representing the RPKM value at 75 DAF, and the second to fourth ones from the left to the right representing the relative log2 (expression ratio) at 75, 80, 85 DAF, respectively. The grids with 10 different colors from blue to red show the absolute expression magnitude at 75 DAF, with the RPKM values 0-10, 10-20, 20-40, 40-80, 80-160, 160-320, 320-640, 640-1280, 1280-2560, and over 2560 represented by colors 1 to 10, respectively, (C) An anthocyanin-related branch of the phylogenetic tree comparing Chinese bayberry R2R3-MYBs amino acid sequences with all MYBs from Arabidopsis thaliana.
Figure 6
Figure 6
Schematic of physiological and metabolic data related to bayberry fruit taste during ripening. (A) Changes in TSS, pH, content of soluble sugars, and content of organic acids, (B) Sucrose metabolism and organic acid degradation through the GABA shunt. Enzyme names, UniGene ids and expression patterns are indicated at the side of each step. The expression patterns of each UniGene are shown by 4 grids, with the left one representing the RPKM value at 75 DAF, and the second to fourth ones from the left to the right representing the relative log2 (expression ratio) at 75, 80, 85 DAF, respectively. The grids with 10 different colors from blue to red show the absolute expression magnitude at 75 DAF, with the RPKM values 0-10, 10-20, 20-40, 40-80, 80-160, 160-320, 320-640, 640-1280, 1280-2560, and over 2560 represented by color 1 to 10, respectively.
Figure 7
Figure 7
Expression of SPS and GAD in bayberry fruit ripening. Error bars on each column indicate SEs from three replicates.

References

    1. Chen K, Xu C, Zhang B, Ferguson IB. Red bayberry: botany and horticulture. Hortic Rev. 2004;30:83–114.
    1. Zhang B, Kang M, Xie Q, Xu B, Sun C, Chen K, Wu Y. Anthocyanins from Chinese bayberry extract protect β cells from oxidative stress-mediated injury via HO-1 up-regulation. J Agric Food Chem. 2010;59(2):537–545. - PubMed
    1. Sun C, Zheng Y, Chen Q, Tang X, Jiang M, Zhang J, Li X, Chen K. Purification and anti-tumour activity of cyaniding-3-O-glucoside from Chinese bayberry fruit. Food Chem. 2012;131:1287–1294. doi: 10.1016/j.foodchem.2011.09.121. - DOI
    1. Zhang SM, Gao ZS, Xu CJ, Chen KS. Genetic diversity of Chinese bayberry (Myrica rubra Sieb. et Zucc.) accessions revealed by amplified fragment length polymorphism. Hortscience. 2009;44(2):487–491.
    1. Zhang SM, Xu CJ, Gao ZS, Chen KS, Wang GY. Development and characterization of microsatellite markers for Chinese bayberry (Myrica rubra Sieb. & Zucc.) Conserv Genet. 2009;10(5):1605–1607. doi: 10.1007/s10592-008-9804-x. - DOI

Publication types

LinkOut - more resources