

Variations in T(2)* and fat content of murine brown and white adipose tissues by chemical-shift MRI
- PMID: 22244539
- PMCID: PMC3288644
- DOI: 10.1016/j.mri.2011.12.004
Variations in T(2)* and fat content of murine brown and white adipose tissues by chemical-shift MRI
Abstract
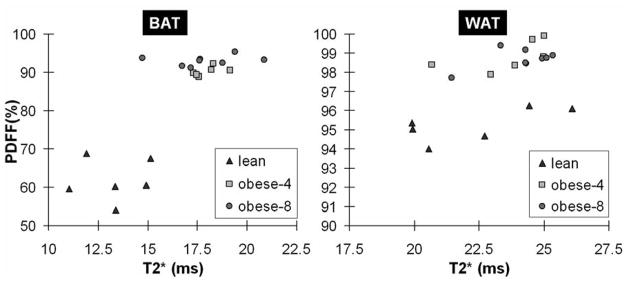
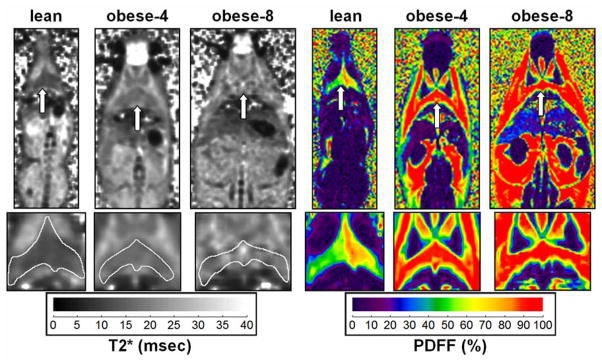
Purpose: The purpose was to compare T(2)* relaxation times and proton density fat-fraction (PDFF) values between brown (BAT) and white (WAT) adipose tissue in lean and ob/ob mice.
Materials and methods: A group of lean male mice (n=6) and two groups of ob/ob male mice placed on similar 4-week (n=6) and 8-week (n=8) ad libitum diets were utilized. The animals were imaged at 3 T using a T(2)*-corrected chemical-shift-based water-fat magnetic resonance imaging (MRI) method that provides simultaneous estimation of T(2)* and PDFF on a voxel-wise basis. Regions of interest were drawn within the interscapular BAT and gonadal WAT depots on co-registered T(2)* and PDFF maps. Measurements were assessed using analysis of variance, Bonferroni-adjusted t test for multigroup comparisons and the Tukey post hoc test.
Results: Significant differences (P<.01) in BAT T(2)* and PDFF were observed between the lean and ob/ob groups. The ob/ob animals exhibited longer BAT T(2)* and greater PDFF than lean animals. However, only BAT PDFF was significantly different (P<.01) between the two ob/ob groups. When comparing BAT to WAT within each group, T(2)* and PDFF values were consistently lower in BAT than WAT (P<.01). The difference was most prominent in the lean animals. In both ob/ob groups, BAT exhibited very WAT-like appearances and properties on the MRI images.
Conclusion: T(2)* and PDFF are lower in BAT than WAT. This is likely due to variations in tissue composition. The values were consistently lower in lean mice than in ob/ob mice, suggestive of the former's greater demand for BAT thermogenesis and reflective of leptin hormone deficiencies and diminished BAT metabolic activity in the latter.
Copyright © 2012 Elsevier Inc. All rights reserved.
Figures
Similar articles
-
Comparison of brown and white adipose tissues in infants and children with chemical-shift-encoded water-fat MRI.J Magn Reson Imaging. 2013 Oct;38(4):885-96. doi: 10.1002/jmri.24053. Epub 2013 Feb 25. J Magn Reson Imaging. 2013. PMID: 23440739 Free PMC article.
-
Comparison of brown and white adipose tissue fat fractions in ob, seipin, and Fsp27 gene knockout mice by chemical shift-selective imaging and (1)H-MR spectroscopy.Am J Physiol Endocrinol Metab. 2013 Jan 15;304(2):E160-7. doi: 10.1152/ajpendo.00401.2012. Epub 2012 Nov 13. Am J Physiol Endocrinol Metab. 2013. PMID: 23149622
-
Discrimination Between Brown and White Adipose Tissue Using a 2-Point Dixon Water-Fat Separation Method in Simultaneous PET/MRI.J Nucl Med. 2015 Nov;56(11):1742-7. doi: 10.2967/jnumed.115.160770. Epub 2015 Aug 13. J Nucl Med. 2015. PMID: 26272809
-
Effect of high fat diets on energy balance and thermogenesis in brown adipose tissue of lean and genetically obese ob/ob mice.J Nutr. 1987 Dec;117(12):2147-53. doi: 10.1093/jn/117.12.2147. J Nutr. 1987. PMID: 3320290 Review.
-
Magnetic Resonance Imaging Techniques for Brown Adipose Tissue Detection.Front Endocrinol (Lausanne). 2020 Aug 7;11:421. doi: 10.3389/fendo.2020.00421. eCollection 2020. Front Endocrinol (Lausanne). 2020. PMID: 32849257 Free PMC article. Review.
Cited by
-
Quantification of brown adipose tissue in vivo using synthetic magnetic resonance imaging: an experimental study with mice model.Quant Imaging Med Surg. 2022 Jan;12(1):526-538. doi: 10.21037/qims-20-1344. Quant Imaging Med Surg. 2022. PMID: 34993098 Free PMC article.
-
Comparison of brown and white adipose tissues in infants and children with chemical-shift-encoded water-fat MRI.J Magn Reson Imaging. 2013 Oct;38(4):885-96. doi: 10.1002/jmri.24053. Epub 2013 Feb 25. J Magn Reson Imaging. 2013. PMID: 23440739 Free PMC article.
-
Characterizing active and inactive brown adipose tissue in adult humans using PET-CT and MR imaging.Am J Physiol Endocrinol Metab. 2016 Jul 1;311(1):E95-E104. doi: 10.1152/ajpendo.00482.2015. Epub 2016 May 10. Am J Physiol Endocrinol Metab. 2016. PMID: 27166284 Free PMC article.
-
Diffuse Optical Spectroscopy and Imaging to Detect and Quantify Adipose Tissue Browning.Sci Rep. 2017 Feb 1;7:41357. doi: 10.1038/srep41357. Sci Rep. 2017. PMID: 28145475 Free PMC article.
-
Cytochrome P450 1B1: An unexpected modulator of liver fatty acid homeostasis.Arch Biochem Biophys. 2015 Apr 1;571:21-39. doi: 10.1016/j.abb.2015.02.010. Epub 2015 Feb 20. Arch Biochem Biophys. 2015. PMID: 25703193 Free PMC article.
References
-
- Himms-Hagen J. Thermogenesis in brown adipose tissue as an energy buffer. Implications for obesity. N Engl J Med. 1984;311(24):1549–1558. - PubMed
-
- Virtanen KA, Lidell ME, Orava J, Heglind M, Westergren R, Niemi T, Taittonen M, Laine J, Savisto NJ, Enerback S, Nuutila P. Functional brown adipose tissue in healthy adults. N Engl J Med. 2009;360(15):1518–1525. - PubMed
-
- Nedergaard J, Cannon B. The changed metabolic world with human brown adipose tissue: therapeutic visions. Cell Metab. 2010;11(4):268–272. - PubMed
Publication types
MeSH terms
Grants and funding
LinkOut - more resources
Full Text Sources
Medical
Miscellaneous
