Comparative Study
. 2012 Mar;180(3):1080-1094.
doi: 10.1016/j.ajpath.2011.11.024. Epub 2012 Jan 11.

Interspecies comparison of human and murine scleroderma reveals IL-13 and CCL2 as disease subset-specific targets

Affiliations
Comparative Study

Interspecies comparison of human and murine scleroderma reveals IL-13 and CCL2 as disease subset-specific targets

Matthew B Greenblatt et al. Am J Pathol. 2012 Mar.

Abstract

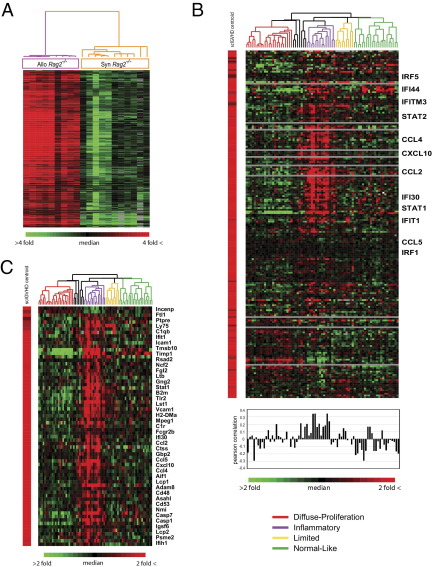
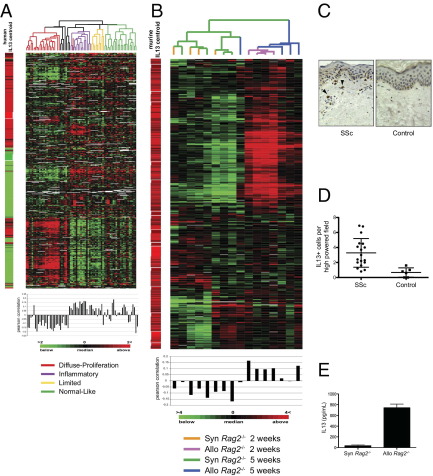
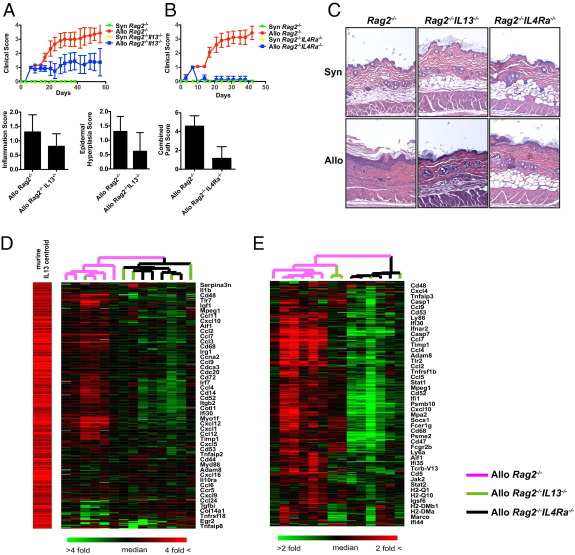
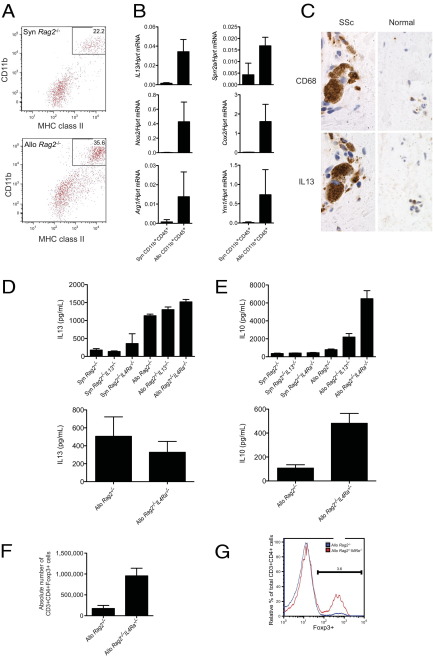
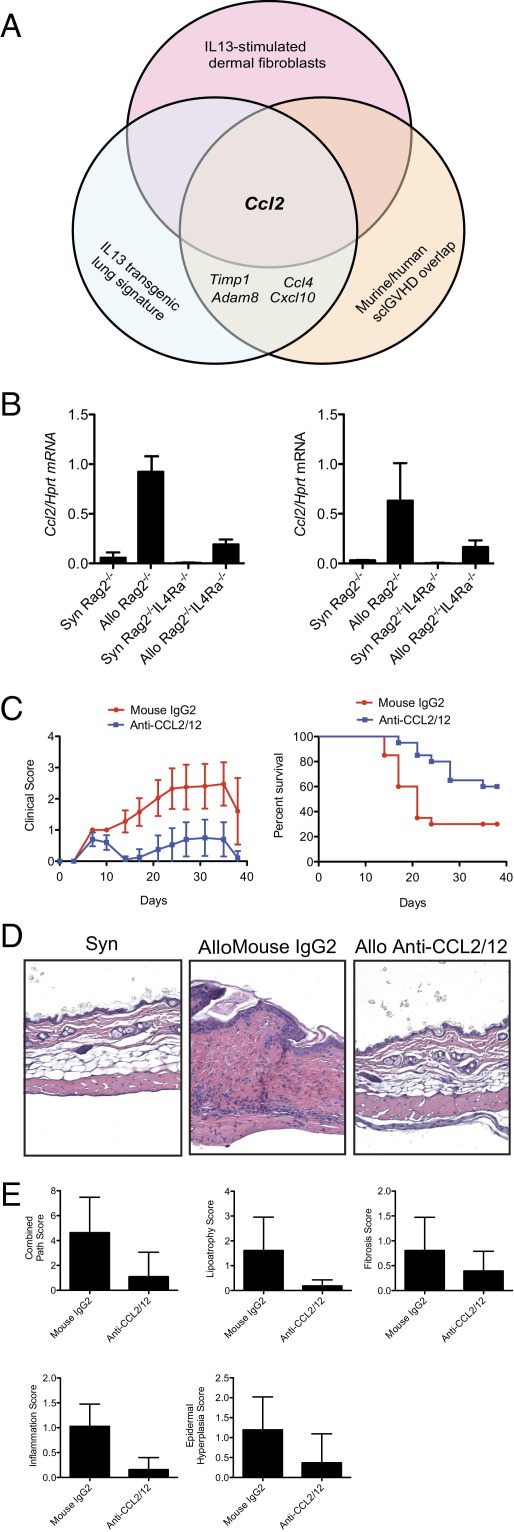
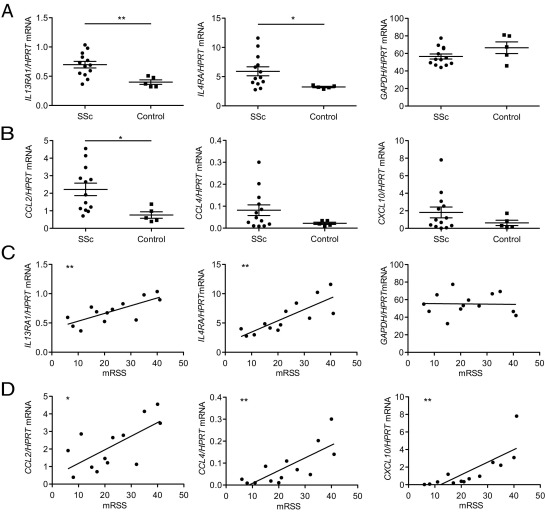
Development of personalized treatment regimens is hampered by lack of insight into how individual animal models reflect subsets of human disease, and autoimmune and inflammatory conditions have proven resistant to such efforts. Scleroderma is a lethal autoimmune disease characterized by fibrosis, with no effective therapy. Comparative gene expression profiling showed that murine sclerodermatous graft-versus-host disease (sclGVHD) approximates an inflammatory subset of scleroderma estimated at 17% to 36% of patients analyzed with diffuse, 28% with limited, and 100% with localized scleroderma. Both sclGVHD and the inflammatory subset demonstrated IL-13 cytokine pathway activation. Host dermal myeloid cells and graft T cells were identified as sources of IL-13 in the model, and genetic deficiency of either IL-13 or IL-4Rα, an IL-13 signal transducer, protected the host from disease. To identify therapeutic targets, we explored the intersection of genes coordinately up-regulated in sclGVHD, the human inflammatory subset, and IL-13-treated fibroblasts; we identified chemokine CCL2 as a potential target. Treatment with anti-CCL2 antibodies prevented sclGVHD. Last, we showed that IL-13 pathway activation in scleroderma patients correlated with clinical skin scores, a marker of disease severity. Thus, an inflammatory subset of scleroderma is driven by IL-13 and may benefit from IL-13 or CCL2 blockade. This approach serves as a model for personalized translational medicine, in which well-characterized animal models are matched to molecularly stratified patient subsets.


Figures

Figure 1
Figure 1
A sclGVHD-associated gene expression signature is enriched in the inflammatory subset of human SSc. A: Genes differentially expressed in skin of sclGVHD mice and syngeneic controls at 2 weeks were identified in two independent cohorts of mice. Allo Rag2−/−, n = 9 mice; Syn Rag2−/−, n = 8 mice + 3 technical replicates. B: The 291 genes in the sclGVHD signature were mapped to 204 human orthologs and expression was extracted from a data set of gene expression in SSc skin (Milano et al4). Samples are ordered by intrinsic SSc subsets (Milano et al4), and the genes are organized by hierarchical clustering. The centroid average of the sclGVHD-associated gene expression signature is shown on the left. Pearson's correlation coefficients between the sclGVHD centroid and each of the SSc samples are plotted below the heat map. The color of the dendrogram indicates statistically significant intrinsic patient subsets. Those patient samples with black dendrograms did not show an association with a specific group (grouped according to Milano et al4). Representative inflammatory subset genes are shown. C: Heat map of the core sclGVHD:inflammatory SSc genes. 1055 differentially expressed genes were identified in the inflammatory subset and compared with 204 human orthologs of the sclGVHD-associated gene signature in B, which resulted in 69 core genes differentially expressed in both diseases. Representative genes are shown.
Figure 2
Figure 2
The IL-13 pathway is activated in SSc and sclGVHD skin. A: Gene expression data for the 491 IL-13–responsive genes identified in human dermal fibroblasts were extracted from the SSc skin data of Milano et al. SSc skin biopsy samples are ordered by intrinsic subset and genes are organized by hierarchical clustering. The centroid average of the IL-13–responsive gene signature at maximal induction (12 and 24 hours) is shown to the left of the heat map. Pearson's correlation coefficients between the centroid and individual patient sample are plotted below each array. B: Expression data for the 734 genes reported by Fulkerson et al as IL-13–inducible genes in mouse lung were extracted from the sclGVHD microarray data set obtained 2 weeks and 5 weeks after splenocyte transfer (n = 4 per group). Genes and arrays were organized by hierarchical clustering. The relative expression of IL-13–inducible genes (centroid) in lungs is shown to the left of the heat map. C: Representative IL-13 IHC on skin biopsies obtained from an SSc patient and a normal control subject. Arrowheads indicate IL-13+ cells. Original magnification, ×400. D: Blinded quantification of the number of IHC IL-13+ cells per high-power field (×600) in skin biopsies from SSc patients and normal control subjects. SSc, n = 18; control, n = 6; P = 0.0037. E: IL-13 ELISA on the tissue culture supernatants of skin explants from BALB/c Rag2−/− mice that received either syngeneic BALB/c (n = 3) or allogeneic B10.D2 (n = 3) splenocytes 2 weeks earlier (P = 0.002).
Figure 3
Figure 3
Host IL-13 and IL-4Rα are required for sclGVHD. A: Blinded biweekly clinical scoring (mean ± 95% CI) and pathological scoring for inflammation (P = 0.0291) or epidermal hyperplasia (P = 0.008) in BALB/c Rag2−/− or BALB/c Rag2−/−IL13/ hosts receiving either syngeneic BALB/c or allogeneic B10.D2 splenocytes. Sample size for clinical score: Syn Rag2−/−, n = 4; Syn Rag2−/−IL13/, n = 2; Allo Rag2−/−, n = 25; Allo Rag2−/−IL13/, n = 20. Sample size for pathological score: Allo Rag2−/−, n = 13; Allo Rag2−/−IL13/, n = 13. B: Blinded biweekly clinical scoring (mean ± 95% CI) and combined pathological scoring (P < 0.0001) in BALB/c Rag2−/− or BALB/c Rag2−/−Il4ra/ hosts receiving either syngeneic BALB/c or allogeneic B10.D2 splenocytes. Sample size for clinical score: Syn Rag2−/−, n = 6; Syn Rag2−/−Il4ra/, n = 3; Allo Rag2−/−, n = 16; Allo Rag2−/−Il4ra/, n = 17. Sample size for pathological score: Allo Rag2−/−, n = 13; Allo Rag2−/−Il4ra/, n = 17. C: Representative histological sections of back skin 6 weeks after the indicated hosts received either syngeneic or allogeneic splenocytes. Original magnification, ×100. Expression of IL-13–inducible genes (D) and the 371 core murine sclGVHD-associated genes (E) (Figure 1A) in expression data sets from BALB/c Rag2−/− (n = 5), BALB/c Rag2−/−IL13/ (n = 4), and BALB/c Rag2−/−Il4ra/ (n = 4) hosts injected with allogeneic splenocytes 2 weeks earlier. The expression values of IL-13–inducible genes (centroid) in lungs (according to Fulkerson et al26) are shown to the left of the heat map in D. Genes and arrays are organized by hierarchical clustering and representative genes are shown. In E, an additional technical replicate for a BALB/c Rag2−/−IL13/ is included.
Figure 4
Figure 4
Characterization of the cellular immunology of sclGVHD. A: Flow cytometric analysis for CD11b and MHC class II on CD45+ cells liberated from the back skin of BALB/c Rag2−/− hosts that received either syngeneic BALB/c or allogeneic B10.D2 splenocytes 2 weeks earlier. B: Quantitative PCR analysis for the expression of the indicated genes from CD45+CD11b+ cells sorted from the skin of control or sclGVHD mice. Each sample represents a pooled value reflecting all Syn Rag2−/− and Allo Rag2−/− mice in an individual experiment. The number of experiments pooled to generate these data and the P values were as follows: IL13, n = 5 (Syn) and n = 6 (Allo), P = 0.0003; Sprr2a, n = 3 (Syn) and n = 4 (Allo), P = 0.012; Nos2, n = 6 (Syn) and n = 4 (Allo), P = 0.0042; Cox2, n = 3 (Syn) and n = 3 (Allo), P = 0.0368; Arg1, n = 5 (Syn) and n = 5 (Allo), P = 0.054; and Ym1, n = 6 (Syn) and n = 5 (Allo), P = 0.022. C: Representative CD68 and IL-13 IHC on skin biopsies obtained from an SSc patient and a normal control subject. Original magnification, ×400. ELISA for IL-13 (D) and IL-10 (E) on tissue culture supernatants of restimulated CD45+CD4+ T cells. CD45+CD4+ T cells were isolated from lymph nodes (upper panels, n = 3 per group) or skin (lower panels) of BALB/c Rag2−/−, BALB/c Rag2−/−IL13/ (lymph nodes only), or BALB/c Rag2−/−Il4ra/ hosts that received either syngeneic BALB/c or allogeneic B10.D2 splenocytes 2 weeks earlier. IL13: n = 3 (lymph nodes) and n = 4 (skin). IL10: n = 3 per group. The lack of a syngeneic control in the lower panels reflects the paucity of T cells infiltrating the skin of syngeneic controls (see Supplemental Figure S3A at http://ajp.amjpathol.org). Absolute numbers of CD3+CD4+Foxp3+ (P < 0.002) (F) and relative percentage of Foxp3 expression (G) within the CD3+CD4+ gate of cells isolated from the cutaneous lymph nodes of BALB/c Rag2−/− or BALB/c Rag2−/−Il4ra/ hosts that received allogeneic B10.D2 splenocytes 2 weeks earlier (n = 4 per group).
Figure 5
Figure 5
The overlap of multiple bioinformatics and experimental approaches identifies CCL2 as a mediator of sclGVHD downstream of IL-13. A: Schematic of how transcripts related to the IL-13 pathway in SSc and sclGVHD were identified from overlapping of the three indicated data sets. Complete lists of genes are given in Supplemental Tables S4, S5, and S8 (available at http://ajp.amjpathol.org). B: Expression of Ccl2 by quantitative RT-PCR in CD45+CD11b+MHC class II+ (left panel) and CD45 (right panel) cells sorted from the skin of BALB/c Rag2−/− or BALB/c Rag2−/−Il4ra/ hosts that received either syngeneic BALB/c or allogeneic B10.D2 splenocytes 2 weeks earlier (n = 3 per group). P = 0.001, Allo Rag2−/− versus Allo Rag2−/−Il4ra/ (CD45+CD11b+MHC class II+; left panel); P = 0.10, Allo Rag2−/− versus Allo Rag2−/−Il4ra/ (CD45; right panel). C: Clinical scores versus time (mean ± 95% CI) and Kaplan-Meier survival curve (P < 0.02) for BALB/c Rag2−/− hosts that received allogeneic B10.D2 splenocytes and randomized on day 0 to biweekly injections of either blocking antibodies to CCL2 (20 mg/kg) and CCL12 (10 mg/kg) (n = 20), or an isotype control antibody (30 mg/kg) (n = 20). D: Representative H&E-stained sections from the back skin of BALB/c Rag2−/− hosts that received either syngeneic BALB/c or allogeneic B10.D2 splenocytes 6 weeks earlier and treated with the indicated antibodies. Original magnification, ×100. E: Pathological scores for BALB/c Rag2−/− hosts that received allogeneic B10.D2 splenocytes and treatment with either blocking antibodies to CCL2/CCL12 (n = 19) or an isotype control antibody (n = 18). P = 0.0003, combined pathological score; P = 0.0007, lipoatrophy; P = 0.0524, fibrosis; P = 0.0008, inflammation; and P = 0.0021, epidermal hypertrophy.
Figure 6
Figure 6
The expression of the IL-13 pathway genes correlates with mRSS in SSc patients. A and B: Quantitative RT-PCR analysis for the expression of the indicated genes in skin biopsies from diffuse SSc patients and normal control subjects. Data points represent individuals; error bars indicate means ± SEM. *P < 0.05; **P < 0.007. C and D: Correlation of the expression of the indicated genes with mRSS obtained at the time of biopsy in SSc patients. *P < 0.05; **P < 0.007. R2 = 0.57, IL13RA1; 0.57; R2 = 0.66, IL4RA; R2 = 0.001, GAPDH; R2 = 0.45, CCL2; R2 = 0.59, CCL4; and R2 = 0.61, CXCL10.

References

    1. Denton C.P., Black C.M., Abraham D.J. Mechanisms and consequences of fibrosis in systemic sclerosis. Nat Clin Pract Rheumatol. 2006;2:134–144. - PubMed
    1. Gu Y.S., Kong J., Cheema G.S., Keen C.L., Wick G., Gershwin M.E. The immunobiology of systemic sclerosis. Semin Arthritis Rheum. 2008;38:132–160. - PubMed
    1. Rogai V., Lories R.J., Guiducci S., Luyten F.P., Matucci Cerinic M. Animal models in systemic sclerosis. Clin Exp Rheumatol. 2008;26:941–946. - PubMed
    1. Milano A., Pendergrass S.A., Sargent J.L., George L.K., McCalmont T.H., Connolly M.K., Whitfield M.L. Molecular subsets in the gene expression signatures of scleroderma skin. PLoS One. 2008;3:e2696. [Erratum appeared in PLoS One 2008, 3(10). doi: 10.1371/annotation/05bed72c-c6f6-4685-a732-02c78e5f66c2] - PMC - PubMed
    1. Ruzek M.C., Jha S., Ledbetter S., Richards S.M., Garman R.D. A modified model of graft-versus-host-induced systemic sclerosis (scleroderma) exhibits all major aspects of the human disease. Arthritis Rheum. 2004;50:1319–1331. - PubMed

Publication types