

Innate response activator B cells protect against microbial sepsis
- PMID: 22245738
- PMCID: PMC3279743
- DOI: 10.1126/science.1215173
Innate response activator B cells protect against microbial sepsis
Abstract
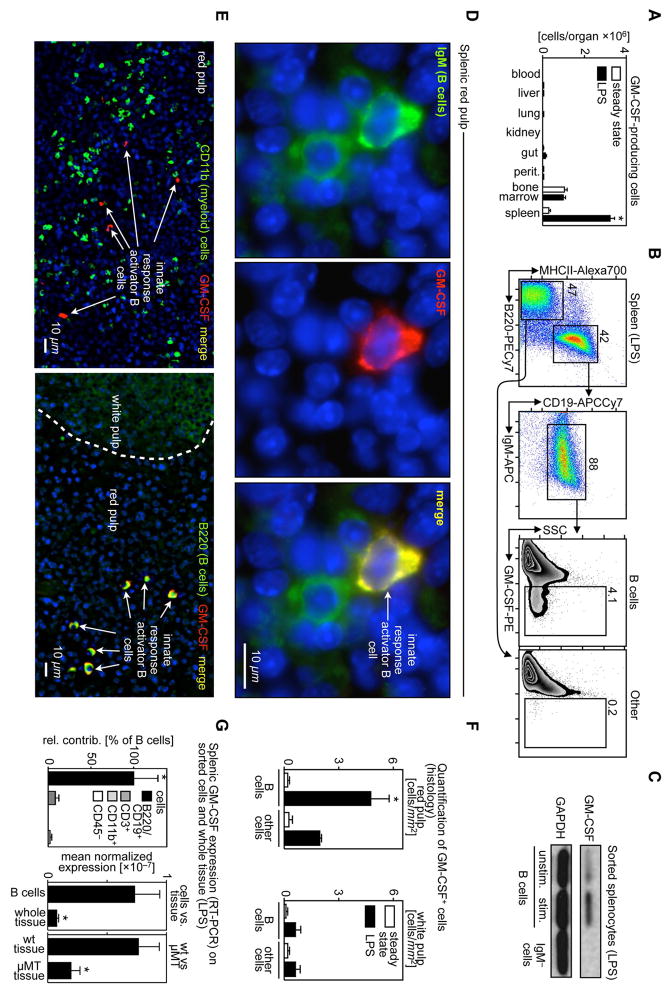
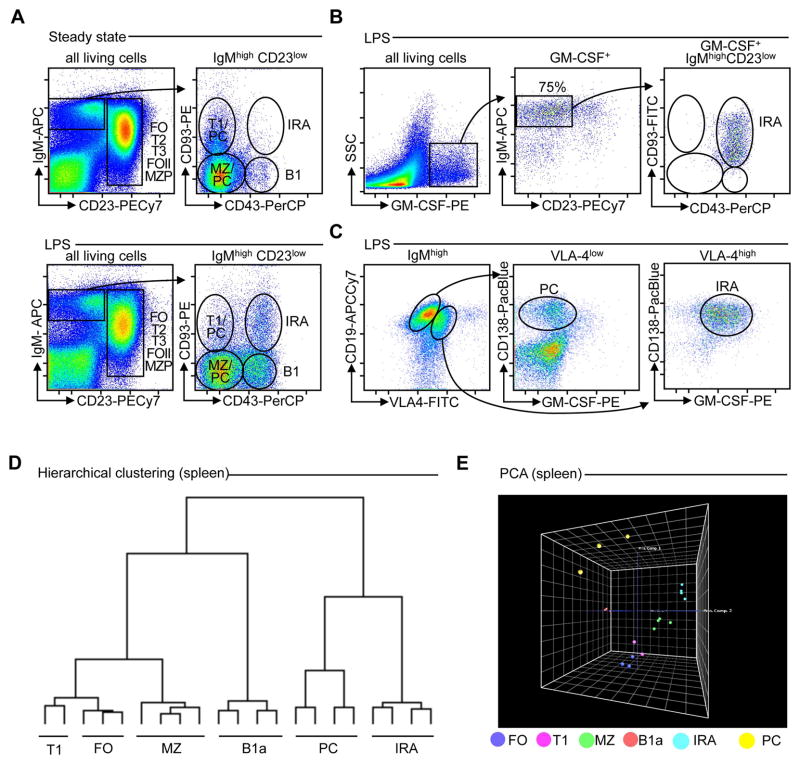
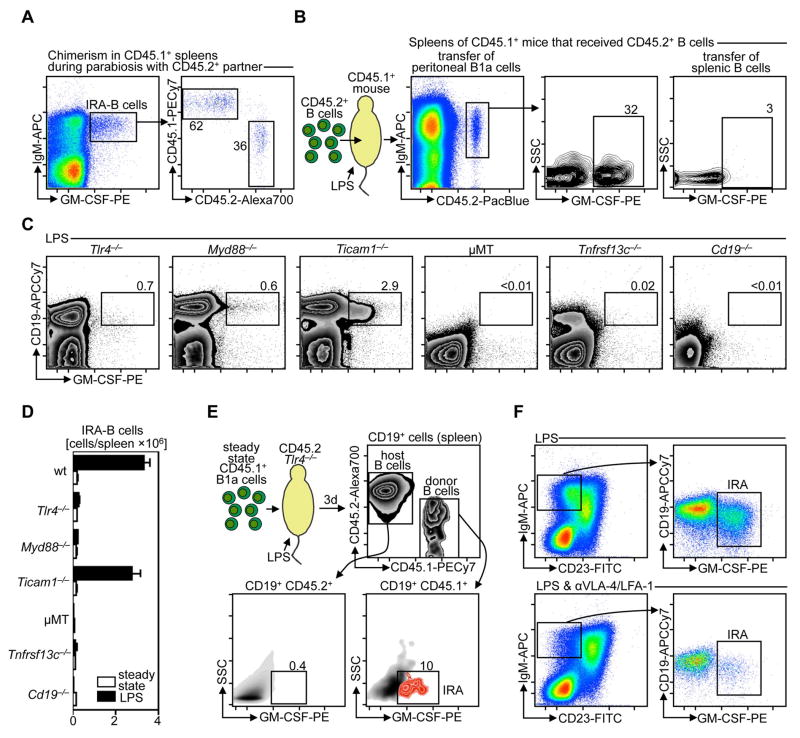
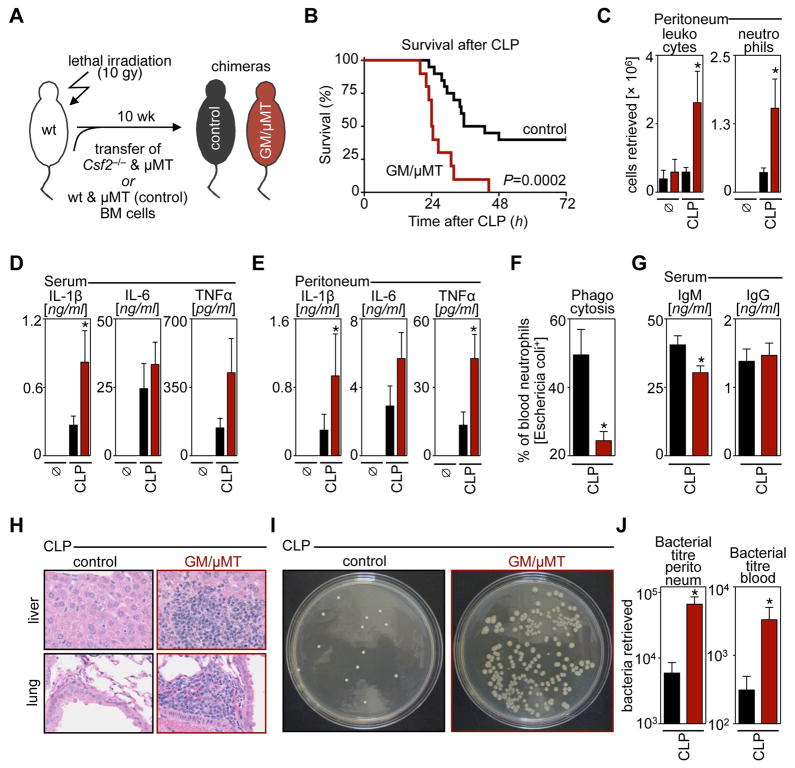
Recognition and clearance of a bacterial infection are a fundamental properties of innate immunity. Here, we describe an effector B cell population that protects against microbial sepsis. Innate response activator (IRA) B cells are phenotypically and functionally distinct, develop and diverge from B1a B cells, depend on pattern-recognition receptors, and produce granulocyte-macrophage colony-stimulating factor. Specific deletion of IRA B cell activity impairs bacterial clearance, elicits a cytokine storm, and precipitates septic shock. These observations enrich our understanding of innate immunity, position IRA B cells as gatekeepers of bacterial infection, and identify new treatment avenues for infectious diseases.
Figures
Similar articles
-
Innate response activator B cells: origins and functions.Int Immunol. 2015 Oct;27(10):537-41. doi: 10.1093/intimm/dxv028. Epub 2015 May 8. Int Immunol. 2015. PMID: 25957266 Free PMC article. Review.
-
Splenic Innate B1 B Cell Plasmablasts Produce Sustained Granulocyte-Macrophage Colony-Stimulating Factor and Interleukin-3 Cytokines during Murine Malaria Infections.Infect Immun. 2019 Nov 18;87(12):e00482-19. doi: 10.1128/IAI.00482-19. Print 2019 Dec. Infect Immun. 2019. PMID: 31591168 Free PMC article.
-
Pleural innate response activator B cells protect against pneumonia via a GM-CSF-IgM axis.J Exp Med. 2014 Jun 2;211(6):1243-56. doi: 10.1084/jem.20131471. Epub 2014 May 12. J Exp Med. 2014. PMID: 24821911 Free PMC article.
-
[The role of IRA B cells in selected inflammatory processes].Postepy Hig Med Dosw (Online). 2016 Mar 16;70:194-9. doi: 10.5604/17322693.1197370. Postepy Hig Med Dosw (Online). 2016. PMID: 27117094 Review. Polish.
-
Newly discovered innate response activator B cells: crucial responders against microbial sepsis.Expert Rev Clin Immunol. 2012 Jul;8(5):405-7. doi: 10.1586/eci.12.32. Expert Rev Clin Immunol. 2012. PMID: 22882214 No abstract available.
Cited by
-
Regulation of emergency granulopoiesis during infection.Front Immunol. 2022 Sep 5;13:961601. doi: 10.3389/fimmu.2022.961601. eCollection 2022. Front Immunol. 2022. PMID: 36148240 Free PMC article. Review.
-
Immune aspects of sepsis and hope for new therapeutics.Curr Infect Dis Rep. 2012 Oct;14(5):474-83. doi: 10.1007/s11908-012-0276-2. Curr Infect Dis Rep. 2012. PMID: 22851006
-
Gut-liver crosstalk in sepsis-induced liver injury.Crit Care. 2020 Oct 19;24(1):614. doi: 10.1186/s13054-020-03327-1. Crit Care. 2020. PMID: 33076940 Free PMC article. Review.
-
Current trends in inflammatory and immunomodulatory mediators in sepsis.J Leukoc Biol. 2013 Mar;93(3):329-42. doi: 10.1189/jlb.0912437. Epub 2012 Nov 7. J Leukoc Biol. 2013. PMID: 23136259 Free PMC article. Review.
-
Single-cell transcriptome mapping identifies a local, innate B cell population driving chronic rejection after lung transplantation.JCI Insight. 2022 Sep 22;7(18):e156648. doi: 10.1172/jci.insight.156648. JCI Insight. 2022. PMID: 36134664 Free PMC article.
References
-
- Cohen J. The immunopathogenesis of sepsis. Nature. 2002;420:885. - PubMed
-
- Martin GS, Mannino DM, Eaton S, Moss M. The epidemiology of sepsis in the United States from 1979 through 2000. N Engl J Med. 2003;348:1546. - PubMed
-
- Hamilton JA. Colony-stimulating factors in inflammation and autoimmunity. Nat Rev Immunol. 2008;8:533. - PubMed
-
-
Materials and methods are available as supporting material on Science Online.
-
Publication types
MeSH terms
Substances
Associated data
- Actions
Grants and funding
LinkOut - more resources
Full Text Sources
Other Literature Sources
Medical
Molecular Biology Databases
