. 2012 May;9(5):823-32.
doi: 10.1016/j.hrthm.2012.01.009. Epub 2012 Jan 11.

Estradiol promotes sudden cardiac death in transgenic long QT type 2 rabbits while progesterone is protective

Affiliations

Estradiol promotes sudden cardiac death in transgenic long QT type 2 rabbits while progesterone is protective

Katja E Odening et al. Heart Rhythm. 2012 May.

Abstract

Background: Postpubertal women with inherited long QT syndrome type 2 (LQT2) are at increased risk for polymorphic ventricular tachycardia (pVT) and sudden cardiac death (SCD), particularly during the postpartum period.

Objective: To investigate whether sex hormones directly modulate the arrhythmogenic risk in LQTS.

Methods: Prepubertal ovariectomized transgenic LQT2 rabbits were treated with estradiol (EST), progesterone (PROG), dihydrotestosterone (DHT), or placebo (OVX).

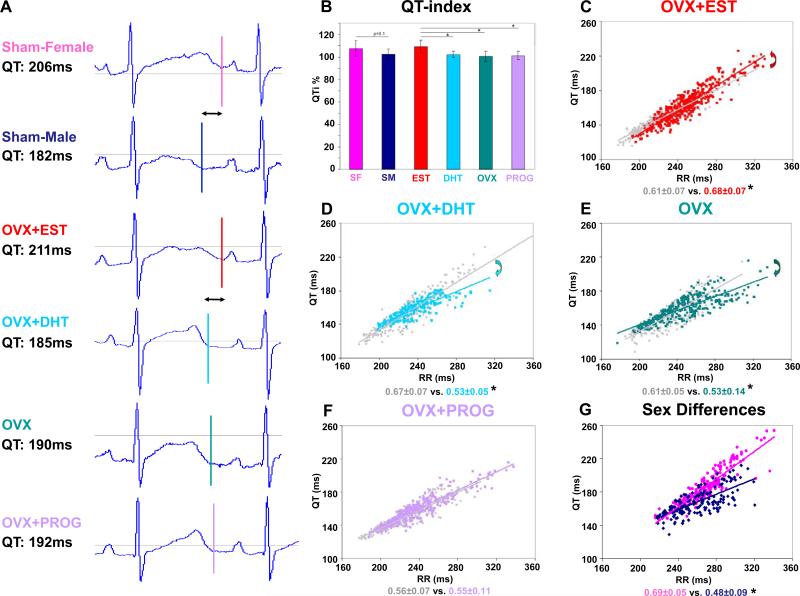
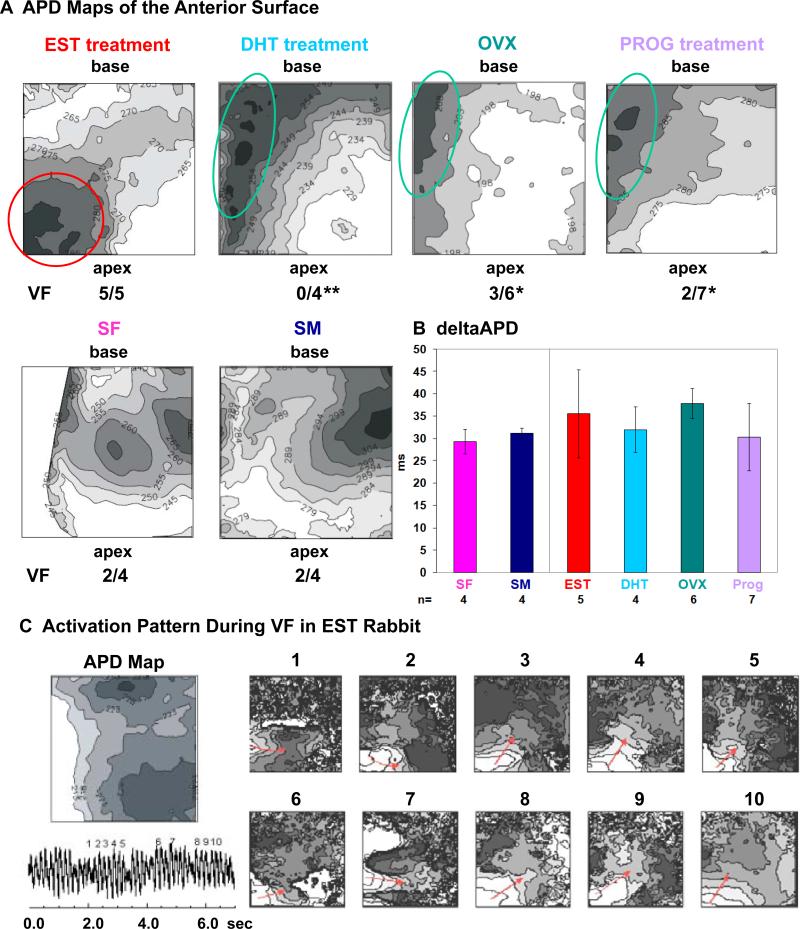
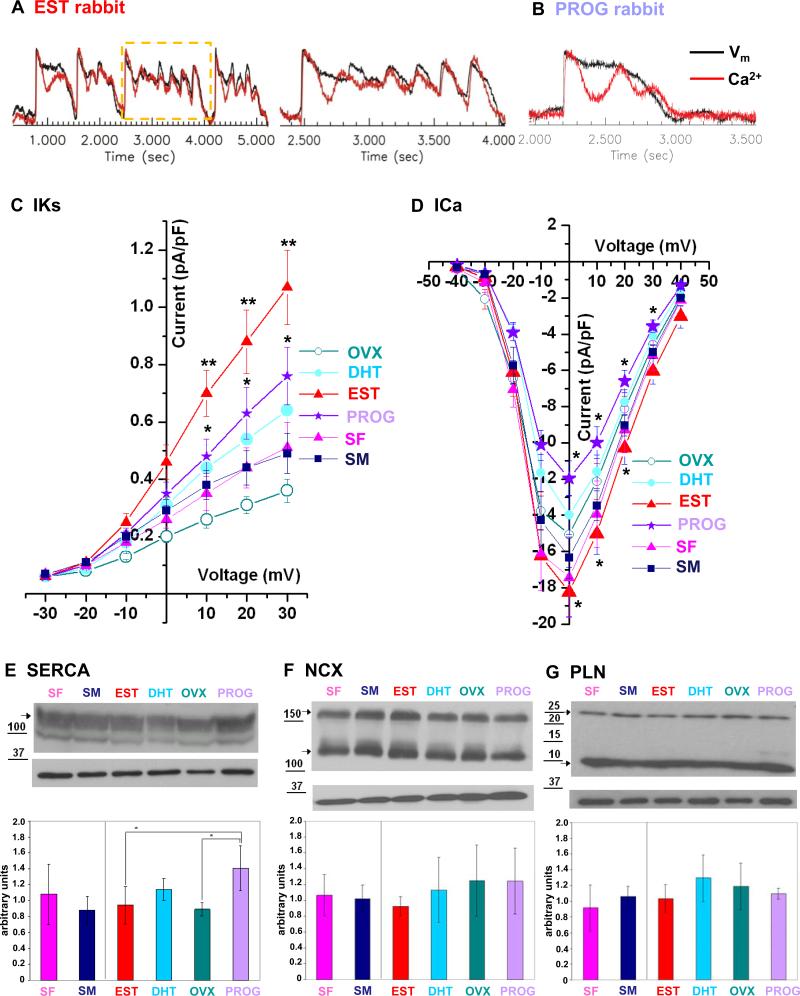
Results: During 8 weeks of treatment, major cardiac events-spontaneous pVT or SCD-occurred in 5 of the 7 EST rabbits and in 2 of the 9 OVX rabbits (P <.05); in contrast, no events occurred in 9 PROG rabbits and 6 DHT rabbits (P <.01 vs PROG; P <.05 vs DHT). Moreover, EST increased the incidence of pVT (P <.05 vs OVX), while PROG reduced premature ventricular contractions, bigeminy, couplets, triplets, and pVT (P <.01 vs OVX; P <.001 vs EST). In vivo electrocardiographic monitoring, in vivo electrophysiological studies, and ex vivo optical mapping studies revealed that EST promoted SCD by steepening the QT/RR slope (P <.05), by prolonging cardiac refractoriness (P <.05), and by altering the spatial pattern of action potential duration dispersion. Isoproterenol-induced Ca(2+) oscillations resulted in early afterdepolarizations in EST-treated hearts (4 of 4), while PROG prevented SCD by eliminating this early afterdepolarization formation in 4 of the 7 hearts (P = .058 vs EST; P <.05 vs OVX). Analyses of ion currents demonstrated that EST increased the density of I(Ca,L) as compared with OVX (P <.05) while PROG decreased it (P <.05).

Conclusion: This study reveals the proarrhythmic effect of EST and the antiarrhythmic effect of PROG in LQT2 in vivo, outlining a new potential antiarrhythmic therapy for LQTS.


Figures

Figure 1
Figure 1. Effect of Sex Hormones on Incidence of Arrhythmias
A. Dot blots of differences in arrhythmia incidences (PVC, bigeminy, couplets, triplets, non-sustained VT (nsVT), all presented as beats/two hours; sustained VT (susVT), duration in seconds). Each dot represents a 2-hour interval of an individual rabbit (n=14 in EST, n=18 in OVX and PROG rabbits). * p<0.05, ** p<0.01, *** p<0.001. B. Telemetric ECG recordings of the initiation of lethal pVT in two EST rabbits, top two rows. Indicated are R-on-T (red square), short-long-short sequences, and P waves (P) during episodes of AV 2:1 block. Bottom row shows several episodes of nsVTs following couplets in an EST rabbit. C. Incidence of major cardiac events during 8 weeks of hormone-treatment. Incidences of SCD are indicated in brackets. * p<0.05, ** p<0.01.
Figure 2
Figure 2. Effect of Sex Hormones on QT Duration
A. Exemplary, representative ECG traces of individual rabbits at 300 ms RR intervals. QT durations are indicated. B. QT indices in n=6 rabbits after 4 weeks of hormone-treatment calculated based on QT and RR intervals acquired over 24-hours of ECG monitoring. * p<0.05. C-F. QT/RR ratio in n=6 rabbits at baseline (grey) and after 4 weeks of treatment (color). Arrows indicate the direction of changes in QT/RR ratio. * p<0.05. G. QT/RR ratio in n=6 adult SF and SM. * p<0.05.
Figure 3
Figure 3. Effect of Sex Hormones on Cardiac Repolarization
A. and B. Surface and intra-cardiac ECG in individual EST and PROG rabbit during VERP determination: (top to bottom) 12 surface ECG leads, right atrium (RA) (2 recordings), RVbase (2 recordings), RVmid (2 recordings), and RVapex. Top panel shows stimulation with 300 ms CL (S1) and coupled extrastimuli (S2) that are captured. Lower panel shows shorter S2 extrastimuli that fail to capture. C. VERP in RVapex (filled bars) and base (hatched bars) in n=6 rabbits per group. * p<0.05, ** p<0.01. All values are shown as mean ± SD. D. Delta-VERP baseline-isoproterenol in RVapex. ** p<0.01, *** p<0.001.
Figure 4
Figure 4. Effect of Sex Hormones on APD Dispersion
A. Representative APD maps of the anterior surface of the LV (field of view 1.5 x 1.5 cm2) of individual rabbits. Isolines of APD are drawn every 5 ms, darker regions represent longer APD. Indicated are regions of long APD in LV mid-base region (green circle) and LVapex (red circle). Rates of VF inducibility are listed. * p<0.05, ** p<0.01. B. ΔAPD defined as longest – shortest APD. All values are shown as mean ± SD. C. Activation pattern during VF in EST rabbit. Displayed are APD map, ECG trace of VF (bottom left), and consecutive maps (1-10) of the activation pattern during VF. Red arrows indicate the direction of activation waves rotating around the apical region of prolonged APD.
Figure 5
Figure 5. Effect of Sex Hormones on Ca2+ Oscillations, EADs, Ion Currents, and Ca2+ Cycling Proteins
A. Representative trace of Ca2+ oscillations and EADs in EST rabbit after ISO bolus. Black line indicates changes in voltage fluorescence signal (Vm); red line indicates changes in Ca2+ signal. The region shown in higher magnification in the right column is indicated by a yellow rectangle. B. Representative trace of Ca2+ oscillations and lack of EAD formation in PROG rabbit after ISO bolus. C.-D. Hormones effects on IKs and ICa,L current densities measured in cardiomyocytes harvested from LVapex of EST (n=15 cardiomyocytes), DHT (n=14), OVX (n=15), PROG (n=18), SF (n=6), and SM (n=6) rabbits. All values are shown as mean ± SEM. IKs: EST vs. OVX: p<0.01; EST vs. PROG, PROG and DHT vs. OVX p<0.05. ICa,L: EST vs. OVX, PROG vs. OVX: p<0.05; EST vs. PROG: p<0.01. E.-G. Representative western blots of SERCA2a, NCX, and PLN. Bar graphs indicate the expression levels of 3 independent experiments in 3 different rabbits per group in arbitrary units. All values are shown as mean ± SD. * p<0.05.

Comment in

References

    1. Roden DM. Clinical practice. Long-QT syndrome. N Engl J Med. 2003;358:169–176. - PubMed
    1. Curran ME, Splawski I, Timothy KW, Vincent GM, Green ED, Keating MT. A molecular basis for cardiac arrhythmia: HERG mutations cause long-QT syndrome. Cell. 1995;80:795–803. - PubMed
    1. Sauer AJ, Moss AJ, McNitt S, et al. Long QT syndrome in adults. J Am Coll Cardiol. 2007;49:329–337. - PubMed
    1. Goldenberg I, Moss AJ, Peterson DR, et al. Risk factors for aborted cardiac arrest and sudden cardiac death in children with the congenital long-QT syndrome. Circulation. 2008;117:2184–2191. - PMC - PubMed
    1. Seth R, Moss AJ, McNitt S, et al. Long QT syndrome and pregnancy. J Am Coll Cardiol. 2007;49:1092–1098. - PubMed

Publication types