. 2012 Jan 15;19(2):220-8.
doi: 10.1038/nsmb.2207.

The splicing factor SRSF1 regulates apoptosis and proliferation to promote mammary epithelial cell transformation

Affiliations

The splicing factor SRSF1 regulates apoptosis and proliferation to promote mammary epithelial cell transformation

Olga Anczuków et al. Nat Struct Mol Biol. .

Abstract

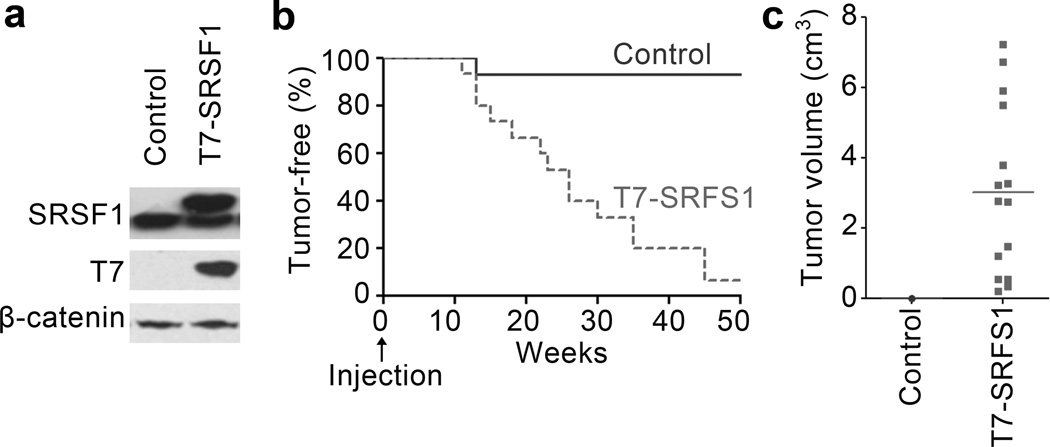
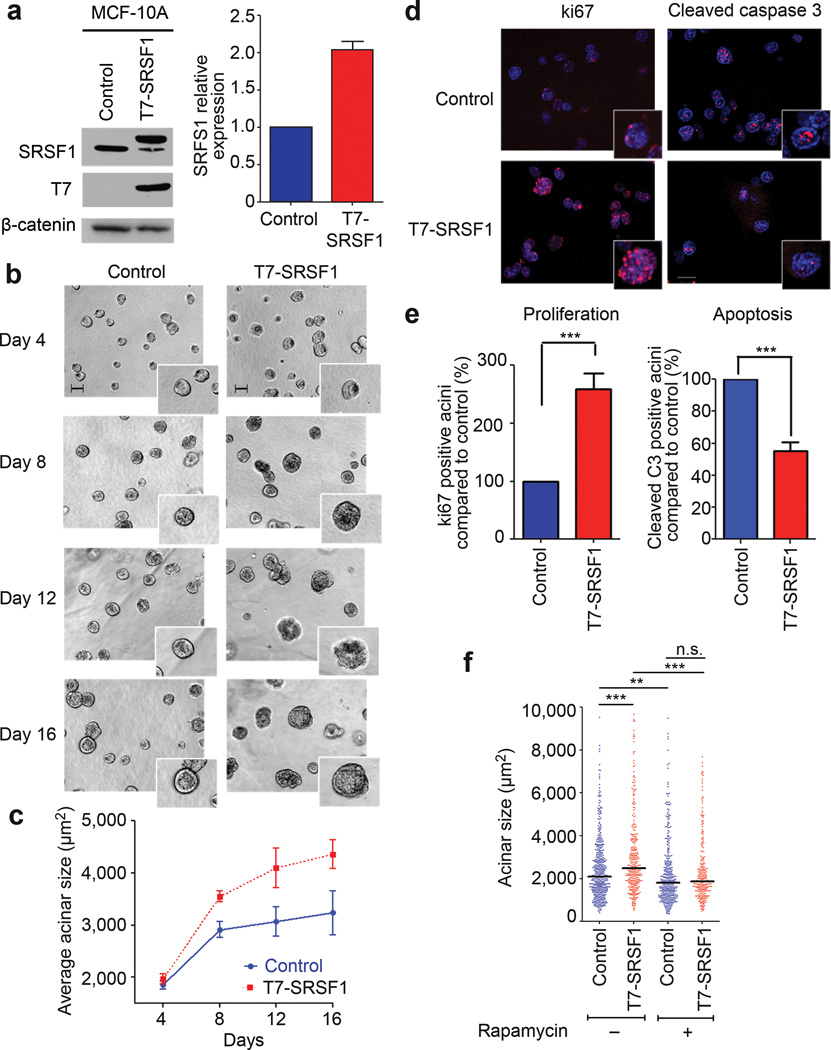
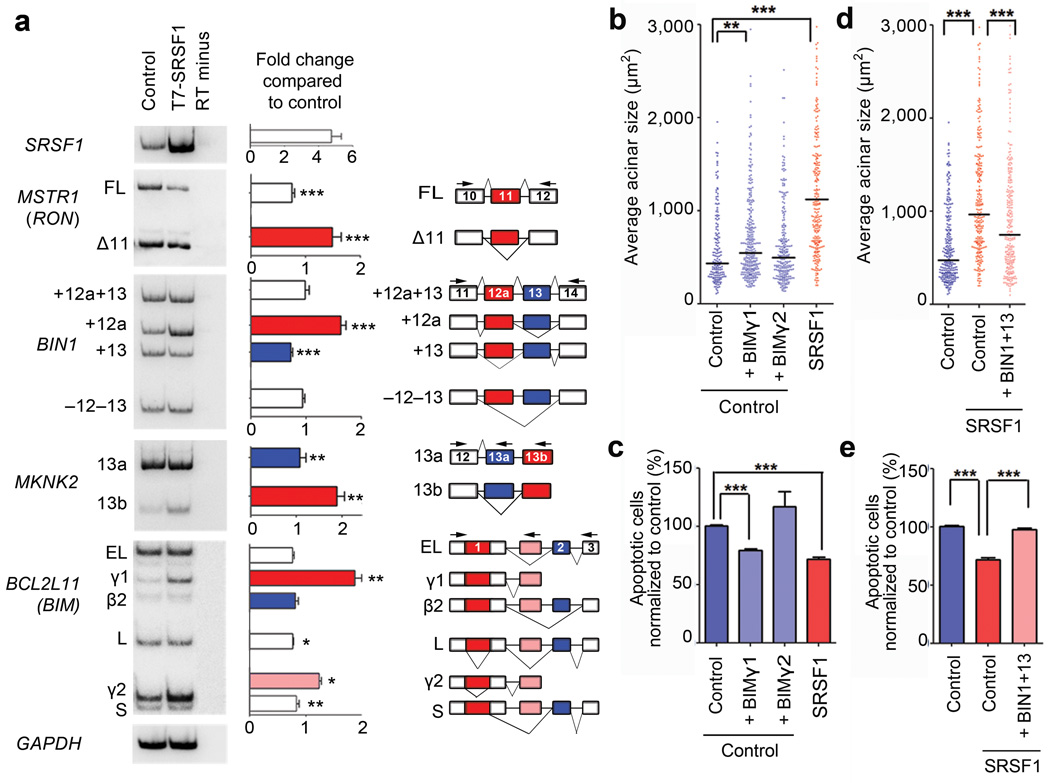
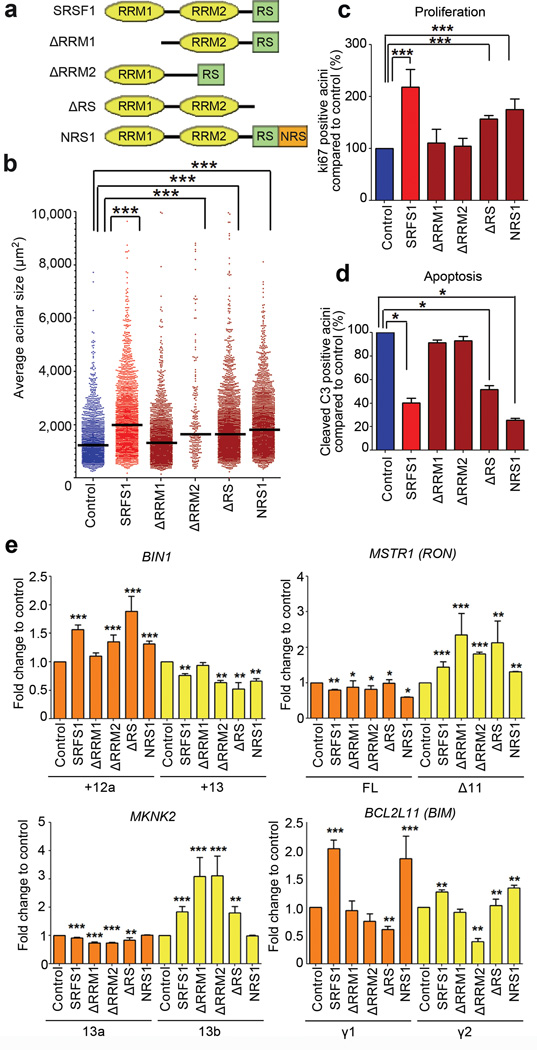
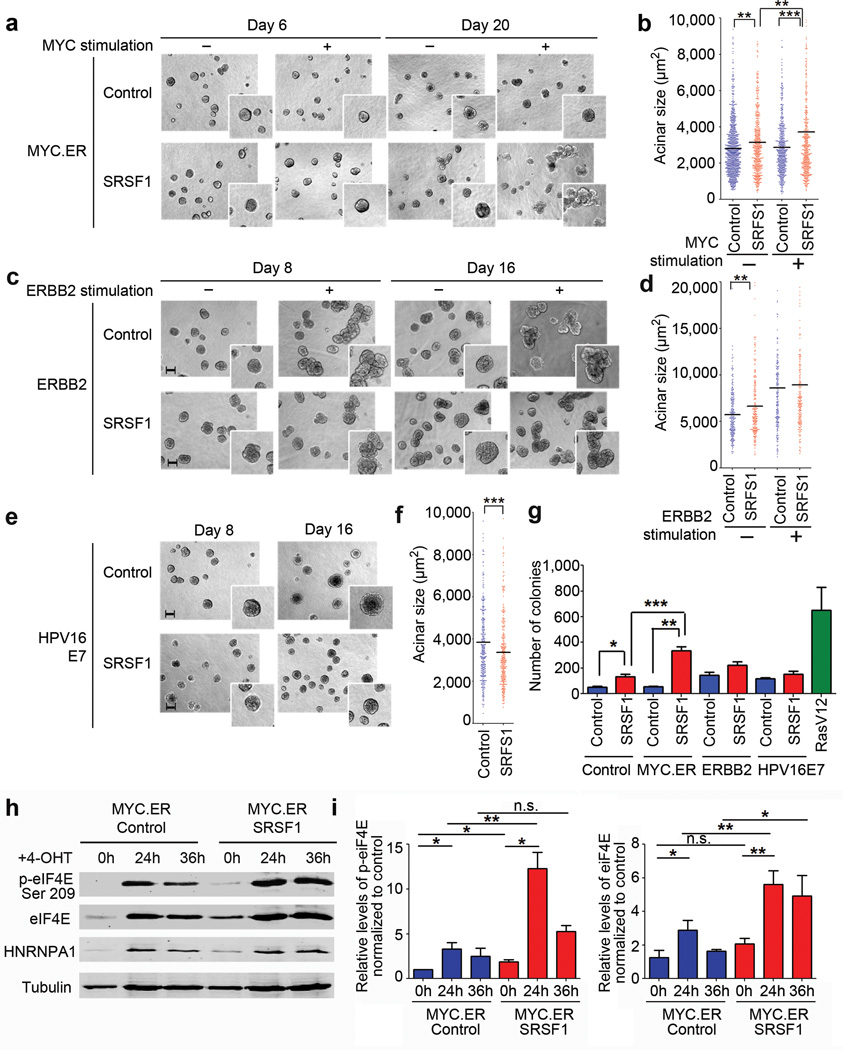
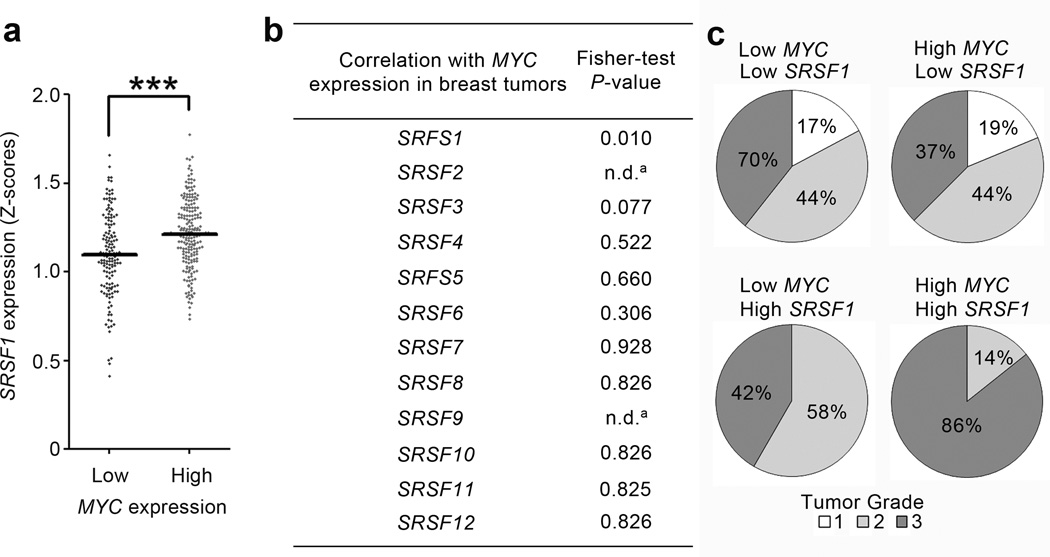
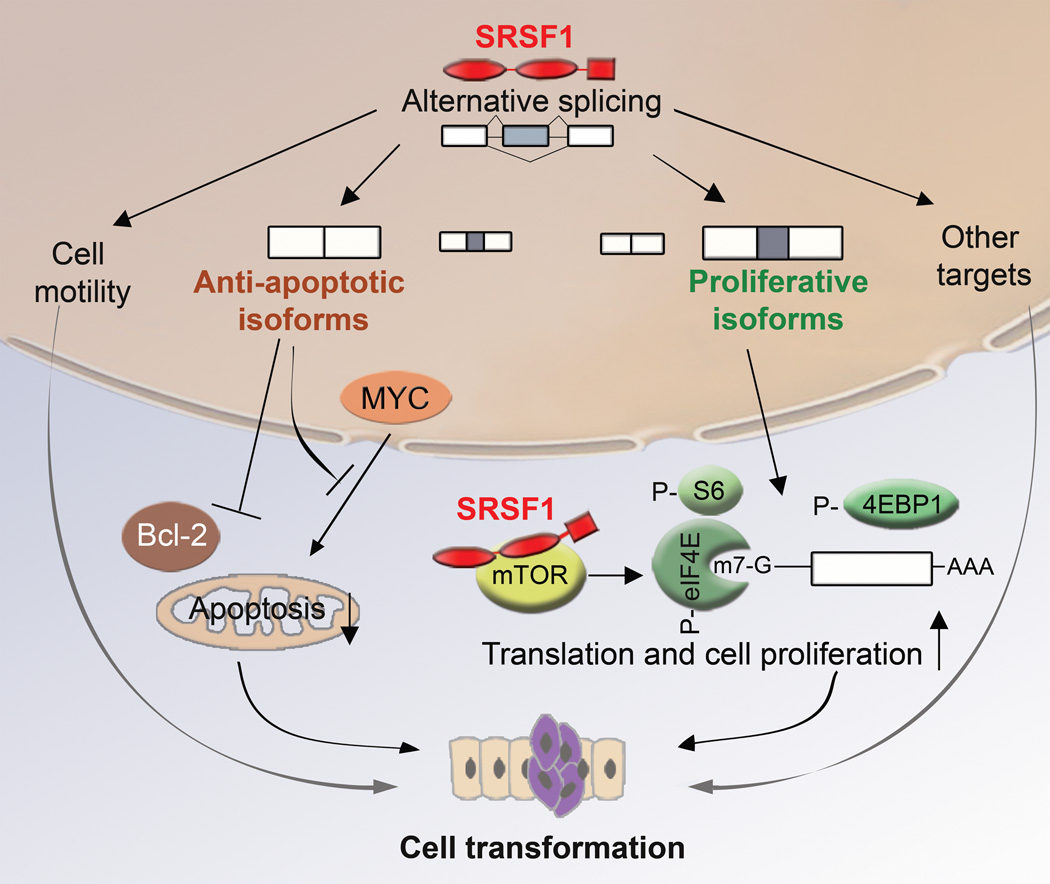
The splicing-factor oncoprotein SRSF1 (also known as SF2/ASF or ASF/SF2) is upregulated in breast cancers. We investigated the ability of SRSF1 to transform human and mouse mammary epithelial cells in vivo and in vitro. SRSF1-overexpressing COMMA-1D cells formed tumors, following orthotopic transplantation to reconstitute the mammary gland. In three-dimensional (3D) culture, SRSF1-overexpressing MCF-10A cells formed larger acini than control cells, reflecting increased proliferation and delayed apoptosis during acinar morphogenesis. These effects required the first RNA-recognition motif and nuclear functions of SRSF1. SRSF1 overexpression promoted alternative splicing of BIM (also known as BCL2L11) and BIN1 to produce isoforms that lack pro-apoptotic functions and contribute to the phenotype. Finally, SRSF1 cooperated specifically with MYC to transform mammary epithelial cells, in part by potentiating eIF4E activation, and these cooperating oncogenes are significantly coexpressed in human breast tumors. Thus, SRSF1 can promote breast cancer, and SRSF1 itself or its downstream effectors may be valuable targets for the development of therapeutics.


Figures

Figure 1
Figure 1
SRSF1-overexpressing cells form tumors in an orthotopic allograft mouse model. (a) Western blot analysis of SRSF1 and T7 tag in COMMA-1D cells stably transduced with control (empty vector) or T7-SRSF1. (b) Tumor-free survival after injection of control and SRSF1-overexpressing COMMA-1D cells into the cleared fat pad of 21-day old female BALB/c mice (n= 15; Mantel-Cox test P<0.0005). (c) Size of tumors collected from the mice described in (b).
Figure 2
Figure 2
Overexpression of SRSF1 in MCF-10A cells increases acinar size in an mTOR-dependent manner. (a) Western blot analysis of SRSF1 and T7 tag in MCF-10A cells stably transduced with control (empty vector) or T7-SRSF1. SRSF1 expression was quantitated in day-8 acini by western blotting with infrared detection, and normalized to a loading control (n=5). Error bars, s.d. (b) 10× phase pictures of MCF-10A control and SRSF1-overexpressing acini from day 4 to day 16. Scale bar: 100 µm. The inserts show details of acinar morphology. (c) Average acinar size from day 4 to day 16 (n≥4, >100 acini per experiment; t-test day 8 P<2×10⁻⁹, day 16 P<5×10⁻¹⁹). Error bars, s.d. (d) Day-8 acini from control and SRSF1-overexpressing cells were immunostained for the proliferation marker ki67, or the apoptosis marker cleaved caspase-3 (red). Nuclei were costained with DAPI (blue). (e) Acini positive for ki67 or cleaved caspase-3 from control and SRSF1-overexpressing samples were counted on day 8. The percentage of positive SRSF1-overexpressing acini was plotted, compared to control acini (n≥3, >50 acini per experiment; Fisher test *** P<0.0001, ** P<0.001). Error bars, s.e.m. (f) The size of control and SRSF1-overexpressing acini was measured on day 16, following 12 days of treatment with rapamycin (10 nM). The dot plot shows the size distribution for each condition, with the median indicated by a horizontal line. (n=3, >100 acini per experiment; Mann-Whitney test *** P<0.0001, ** P<0.0006, n.s. not significant).
Figure 3
Figure 3
Alternative splicing of target genes in 3-D MCF-10A is involved in the SRSF1-induced phenotype. (a) RT-PCR analysis of SRSF1 target genes (RON, BIN1, MKNK2, and BIM) expressed in control and T7-SRSF1-overexpressing acini. Total RNA was analyzed by radioactive RT-PCR using the indicated primers (arrowheads), followed by native PAGE and autoradiography. GAPDH mRNA was used as a loading control. The exon-intron structure of each isoform is indicated (not to scale). Alternatively spliced exons are colored. The ratio of each isoform was quantified, and expressed as the fold change between control and T7-SRSF1-overexpressing acini (n≥6; t-test *** P<0.001, ** P<0.005, * P<0.01). Error bars, s.e.m. (b, d) The size of control and SRSF1-overexpressing acini overexpressing either the BIM γ1 or γ2 isoforms (b) or the BIN1+13 isoform (d) as indicated, was measured on day 8. The dot plot shows the size distribution for each condition, with the median indicated by a horizontal line. (n=3, >100 acini per experiment; Mann-Whitney test *** P<0.0001, ** P<0.001). (c, e) The level of apoptosis in control and SRSF1-overexpressing MCF-10A cells overexpressing either the BIM γ1 or γ2 isoforms (c) or the BIN1 13 isoform (e) as indicated, was measured by flow cytometry with Annexin V and PI staining. (n=3, t-test *** P<0.0001). Error bars, s.e.m.
Figure 4
Figure 4
The SRSF1-induced increase in acinar size requires RRM1 and SRSF1 nuclear functions. (a) SRSF1 deletion mutants lack either RRM1, RRM2, or the RS domain; NRS1 consists of a C-terminal fusion to a nuclear retention signal from SRSF2. (b) Acinar sizes of control and wild-type or mutant SRSF1-overexpressing acini measured on day 8. The dot plot shows the size distribution and the median (horizontal line) for each condition. (n≥3, >150 acini per experiment; Mann-Whitney test *** P<0.001). (c, d) Proliferation (c) and apoptosis (d) in wild-type and mutant SRSF1-overexpressing acini were quantified on day 8, compared to control acini, as described in Fig. 2d (n≥3, >50 acini per condition; Fisher test *** P<0.0001; * P<0.01). Error bars, s.e.m. (e) Quantification of the level of BIN1, MKNK2, RON, and BIM AS isoforms in wild-type or mutant SRSF1-overexpressing acini on day 8, compared to control acini, as in Fig. 3a. Total RNA was analyzed by RT-PCR. Isoforms described in Fig. 3a are indicated. (n≥3; t-test *** P<0.001; ** P<0.001; * P<0.01). Error bars, s.e.m. Representative gels are shown in Supplementary Fig. 6b. See Supplementary Table 1 for summary information.
Figure 5
Figure 5
SRSF1 cooperates with MYC, but not with ERBB2 or HPV16 E7. (a, c, e) 10× phase pictures of MCF-10A control acini or overexpressing SRSF1 together with estrogen-receptor (ER)-inducible MYC (a), inducible ERBB2 (c) or HPV16 E7 (e). The inserts show details of acinar morphology. Scale bar: 100 µm. MYC.ER acini were stimulated with 4-OHT from day 3 to day 20 to activate MYC.ER. ERBB2 acini were stimulated with AP1510 to activate ERBB2 from day 4 to day 8 or from day 8 to day 16. (b, d, f) Size of control acini or overexpressing SRSF1 together with MYC measured on day 20 (b), with ERBB2 on day 16 (d), and with HPV16 E7 on day 16 (f). The dot plot shows the size distribution and the median (horizontal line) for each condition. (n≥3, >100 acini per experiment; Mann-Whitney test *** P< 0.0001, ** P<0.001). (g) MCF-10A control cells or overexpressing SRSF1 together with MYC, HPV16 E7, or ERBB2 were plated in soft agar, and colonies were counted after 30 days. MCF-10A cells overexpressing RasV12 were used as a positive control (n=3; t-test *** P<0.001, ** P<0.005, * P<0.02). Error bars, s.d. (h) Western blot analysis of MCF-10A cells control cells or overexpressing inducible MYC.ER together with SRSF1 using phospho- and total eIF4E antibodies. hnRNPA1 was used as a control for MYC activation upon 4-OHT treatment for the indicated time points. (i) Quantification of phospho- and total eIF4E levels in cells from (h) normalized to tubulin loading control and to the level of MYC.ER control cells at 0 h (n=3; t-test **P<0.001, *P<0.05, n.s. not significant). Error bars, s.d.
Figure 6
Figure 6
SRSF1 is frequently overexpressed in human breast tumors with elevated MYC. (a) Expression of SRSF1 was profiled from microarray data from a collection of 352 human breast tumors (GSE2109). The data were normalized to Z-score (see Methods) and divided into two categories: breast tumors expressing high or low MYC levels. The dot plot shows the distribution and the median (horizontal line) for each condition (Mann-Whitney test *** P<0.0001). (b) Expression of all members of the SR protein family was profiled as in (a) and divided into four categories according to SRSF and MYC RNA levels: (i) both low; (ii) both high; (iii) low MYC and high SRSF; (iv) high MYC and low SRSF. A Fisher-test was performed to compare the different categories, and P-values are shown on the right (a There were not enough samples for SRSF2 and SRSF9 with low SRSF expression to derive a P-value). (c) Expression of SRSF1 and MYC was profiled from microarray data from another collection of 196 human breast tumors with histological grading annotation (GSE7390). The data were normalized to Z-score (see Methods) and divided into four categories according to SRSF1 and MYC levels, as indicated. Histological grading of the tumors is indicated for each category, grade 3 being the most malignant. Tumors with high levels of MYC and SRSF1 have more grade-3 samples, compared to tumors with low SRSF1 and/or MYC levels (Fisher-test: P< 0.03).
Figure 7
Figure 7
A model for SRSF1’s role in transformation. SRSF1 regulates AS of target genes involved in apoptosis, cell motility, proliferation, and other cellular functions. SRSF1 overexpression promotes expression of anti-apoptotic isoforms unable to interact with pro-apoptotic factors, or that inhibit the action of pro-apoptotic factors, such as MYC or members of the Bcl-2 family. In parallel, SRSF1 overexpression promotes expression of isoforms that stimulate translation and cell proliferation, by increasing phosphorylation of translation activators, such as S6 or eIF4E, or by inhibiting translational repressors, such as 4EBP1. SRSF1 can also interact with and activate mTOR to promote translation. By increasing proliferation and decreasing apoptosis, SRSF1 promotes cellular transformation.

References

    1. Wang ET, et al. Alternative isoform regulation in human tissue transcriptomes. Nature. 2008;456:470–476. - PMC - PubMed
    1. Cartegni L, Chew SL, Krainer AR. Listening to silence and understanding nonsense: exonic mutations that affect splicing. Nat Rev Genet. 2002;3:285–298. - PubMed
    1. Mayeda A, Krainer AR. Regulation of alternative pre-mRNA splicing by hnRNP A1 and splicing factor SF2. Cell. 1992;68:365–375. - PubMed
    1. Caceres JF, Stamm S, Helfman DM, Krainer AR. Regulation of alternative splicing in vivo by overexpression of antagonistic splicing factors. Science. 1994;265:1706–1709. - PubMed
    1. Srebrow A, Kornblihtt AR. The connection between splicing and cancer. J Cell Sci. 2006;119:2635–2641. - PubMed

Publication types

Substances