. 2012 Apr 26;119(17):4047-55.
doi: 10.1182/blood-2011-09-377820. Epub 2012 Jan 12.

Glucose-6-phosphatase-β, implicated in a congenital neutropenia syndrome, is essential for macrophage energy homeostasis and functionality

Affiliations

Glucose-6-phosphatase-β, implicated in a congenital neutropenia syndrome, is essential for macrophage energy homeostasis and functionality

Hyun Sik Jun et al. Blood. .

Abstract

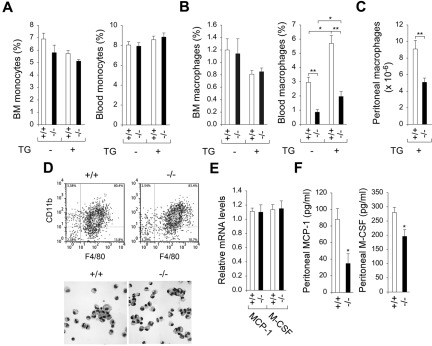
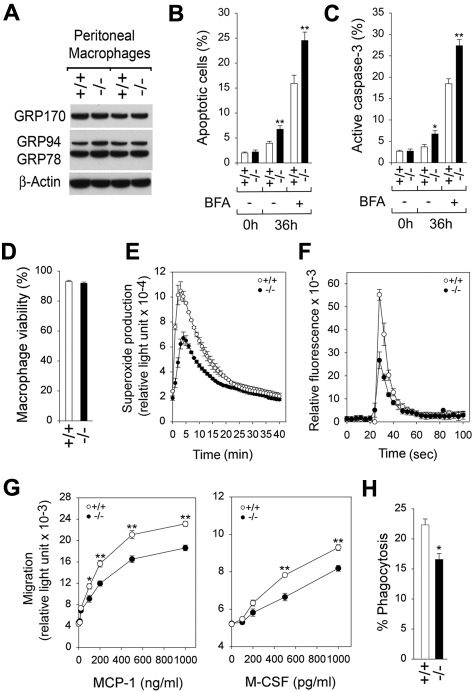
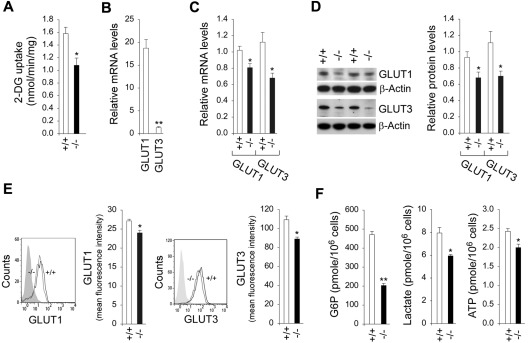
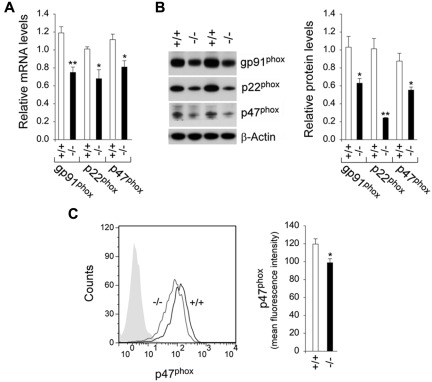
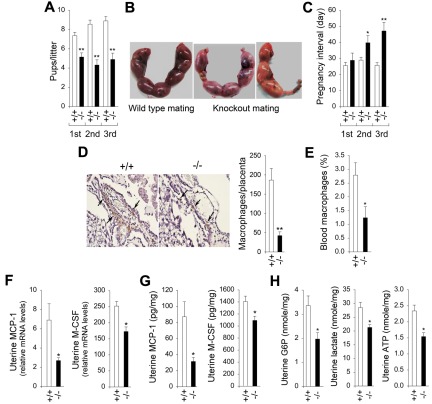
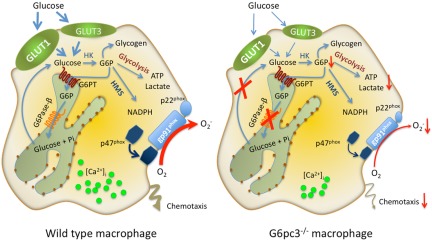
Glucose-6-phosphatase-β (G6Pase-β or G6PC3) deficiency, also known as severe congenital neutropenia syndrome 4, is characterized not only by neutropenia but also by impaired neutrophil energy homeostasis and functionality. We now show the syndrome is also associated with macrophage dysfunction, with murine G6pc3(-/-) macrophages having impairments in their respiratory burst, chemotaxis, calcium flux, and phagocytic activities. Consistent with a glucose-6-phosphate (G6P) metabolism deficiency, G6pc3(-/-) macrophages also have a lower glucose uptake and lower levels of G6P, lactate, and ATP than wild-type macrophages. Furthermore, the expression of NADPH oxidase subunits and membrane translocation of p47(phox) are down-regulated, and G6pc3(-/-) macrophages exhibit repressed trafficking in vivo both during an inflammatory response and in pregnancy. During pregnancy, the absence of G6Pase-β activity also leads to impaired energy homeostasis in the uterus and reduced fertility of G6pc3(-/-) mothers. Together these results show that immune deficiencies in this congenital neutropenia syndrome extend beyond neutrophil dysfunction.


Figures

Figure 1
Figure 1
G6pc3−/− macrophages exhibit impaired trafficking in vivo. Macrophages were isolated from 6- to 8-week-old wild-type (+/+) and G6pc3−/− (−/−) littermates. Monoctyes (SSCloGr-1−/lo/+/CD11b+) and macrophages (F4/80+/CD11b+) were analyzed by flow cytometry. (A) BM and blood monocyte counts in wild-type (n = 8) and G6pc3−/− (n = 8) mice in the absence and presence of thioglycollate (TG). (B) BM and blood macrophage counts in wild-type (n = 8) and G6pc3−/− (n = 8) mice in the absence and presence of TG. (C) The total peritoneal macrophage counts in wild-type (n = 8) and G6pc3−/− (n = 8) mice challenged with TG. (D) Flow cytometric analysis of peritoneal macrophages in control and G6pc3−/− mice and Hema 3-stained cytospins of peritoneal macrophages at magnification of ×400. (E) Quantification of MCP-1 and M-CSF mRNA in peritoneal macrophages by real-time RT-PCR. Expression is normalized to β-actin and measured relative to one wild-type mouse arbitrarily defined as 1. (F) The levels of MCP-1 and M-CSF in peritoneal exudates of wild-type (n = 8) and G6pc3−/− (n = 8) mice after intraperitoneal injection of TG. Data represent the mean ± SEM. **P < .005 and *P < .05.
Figure 2
Figure 2
Analysis of ER stress, apoptosis, and functionality in G6pc3−/− macrophages. Peritoneal macrophages were isolated from 6- to 8-week-old wild-type (+/+) and G6pc3−/− (−/−) littermates. Freshly isolated macrophages were used to examine ER stress and apoptosis. For functional analysis, macrophages were further enriched by CD11b microbeads binding. (A) Western blot analysis of protein extracts of macrophages with the use of Abs against GRP170, GRP78/GRP94, or β-actin. Data from 2 pairs of littermates are shown, and each lane contains 50 μg of protein. (B) Quantification of apoptotic cells in macrophages of control (n = 6) and G6pc3−/− (n = 6) mice during culturing in vitro in the absence or presence of BFA. Results represent the mean ± SEM. (C) Quantification of active caspase-3 in macrophages of control (n = 4) and G6pc3−/− (n = 4) mice during culturing in vitro in the absence or presence of BFA. (D) The viability of CD11b-enriched macrophages from wild-type (n = 10) and G6pc3−/− (n = 10) mice, estimated by flow cytometry. Results represent the mean ± SEM. (E) Macrophage respiratory burst activity in response to 200 ng/mL PMA. (F) Macrophage calcium flux in response to 10−7M of leukotriene D4. (G) Macrophage concentration-dependent chemotaxis in response to MCP-1 or M-CSF. (H) Macrophage phagocytosis activity. Quantification of bioparticle-positive macrophages in control and G6pc3−/− mice; the numbers reflect the percentage of total macrophage that have engulfed particles. Data represent the mean ± SEM of 3 independent experiments. **P < .005 and *P < .05.
Figure 3
Figure 3
Analysis of 2-DG uptake, the expression of GLUTs, and intracellular G6P, lactate, and ATP levels in G6pc3−/− macrophages. The CD11b-enriched macrophages used for function analysis were isolated from 6- to 8-week-old wild-type (+/+) and G6pc3−/− (−/−) littermates. For 2-DG uptake and quantitative real-time RT-PCR, the data represent the mean ± SEM of 4 independent experiments. (A) Uptake of 2-DG in macrophages. (B) Quantification of GLUT1 and GLUT3 mRNA in wild-type macrophages by real-time RT-PCR. Expression is normalized to β-actin and measured relative to 1 wild-type GLUT3 arbitrarily defined as 1. (C) Quantification of GLUT1 and GLUT3 mRNA in wild-type and G6pc3−/− macrophages by real-time RT-PCR. Expression is normalized to β-actin and measured relative to 1 wild-type mouse arbitrarily defined as 1. (D) Western blot analysis of protein extracts of peritoneal macrophages with the use of Abs against GLUT1, GLUT3, or β-actin. Each lane contains 50 μg of protein. The relative GLUT1 and GLUT3 protein levels were quantified by densitometry of 4 separate pairs of Western blots, and the measurements are relative to β-actin. (E) Quantitative flow cytometric analysis of membrane-bound GLUT1 and GLUT3 in macrophages. The gray tracing represents the fluorescence background. Data represent the mean ± SEM of 4 independent experiments. (E) Macrophage G6P, lactate, and ATP levels. Data represent the mean ± SEM of 4 independent experiments. **P < .005 and *P < .05.
Figure 4
Figure 4
Analysis of the expression of NADPH oxidase in G6pc3−/− macrophages. The CD11b-enriched macrophages used for function analysis were isolated from 6- to 8-week-old wild-type (+/+) and G6pc3−/− (−/−) littermates. (A) Quantification of gp91phox, p22phox, and p47phox mRNA in macrophages by real-time RT-PCR. Expression is normalized to β-actin and measured relative to 1 wild-type mouse arbitrarily defined as 1. Data represent the mean ± SEM of 4 independent experiments. (B) Western blot analysis of macrophage protein extracts with the use of Abs against gp91phox, p22phox, p47phox, or β-actin. Data from 2 pairs of littermates are shown, and each lane contains 50 μg of protein. The relative protein levels of gp91phox, p22phox, and p47phox were quantified by densitometry of 4 separate pairs of Western blots. The measurements are relative to β-actin. (C) Quantitative flow cytometric analysis of membrane-bound p47phox in macrophages. The gray tracing represents the fluorescence background. Data represent the mean ± SEM of 4 independent experiments. **P < .005 and *P < .05.
Figure 5
Figure 5
G6pc3−/− mice exhibit reduced fertility. (A-C) Pup size and pregnancy intervals in wild-type and knockout matings. Sixteen pairs of wild-type and 16 pairs of knockout matings were set up with 8- to 10-week-old unaffected (+/+) and G6pc3−/− (−/−) littermates. The pregnancy outcome was examined for 3 consecutive pregnancies. (A) The litter size. (B) Representative placentas at gestation day 15 in wild-type and knockout matings. (C) The intervals between the first 3 serial pregnancies. Values represent mean ± SEM. Data were measured for each pregnancy. (D) Representative IHC analysis of macrophages in the decidual region of the gestation day 15 placenta in wild-type (n = 8) and G6pc3−/− (n = 8) matings at magnifications of ×400 and quantification of macrophage counts. Values represent mean ± SEM. Arrows denote macrophages. In wild-type placenta, numerous macrophages accumulated along the deciduas, and in G6pc3−/− placenta few macrophages were seen. (E) Blood macrophage counts in wild-type (n = 8) and G6pc3−/− (n = 8) mothers at gestation day 15, expressed as a percentage of total white blood cells. (F) Quantification of uterine MCP-1 and M-CSF mRNA in wild-type (n = 8) and G6pc3−/− (n = 8) mothers at gestation day 15 by real-time RT-PCR. Levels are expressed as a ratio of uterine tissue to peritoneal macrophages. (G) Quantikine ELISA analysis of the levels of uterine MCP-1 and M-CSF in wild-type (n = 8) and G6pc3−/− (n = 8) mothers at gestation day 15. (H) Uterine G6P, lactate, and ATP levels in wild-type (n = 8) and G6pc3−/− (n = 8) mothers at gestation day 15. Data represent the mean ± SEM. **P < .005 and *P < .05.
Figure 6
Figure 6
Proposed pathways for G6P metabolism in wild-type and G6pc3−/− macrophages. Glucose transported into the cytoplasm by GLUT1 and GLUT3 is metabolized by hexokinase (HK) to G6P which can participate in glycolysis, hexose monophosphate shunt (HMS) pathway, glycogen synthesis, or be translocated into the lumen of the ER by the G6PT. In normal macrophages, G6P localized within the ER lumen can be hydrolyzed by G6Pase-β, and the resulting glucose transported back into the cytoplasm to reenter any of the previously mentioned cytoplasmic pathways. However, in G6pc3−/− macrophages, which lack a functional G6Pase-β, ER-localized G6P cannot be recycled to the cytoplasm. Consequently, G6pc3−/− macrophages exhibit reduced glucose uptake and impaired energy homeostasis, leading to impaired functionality. The GLUT1 and GLUT3 transporters, responsible for the transport of glucose in and out of the cell, is shown embedded in the plasma membrane. The G6PT transporter, responsible for the transport of G6P into the ER, and G6Pase-β, responsible for hydrolyzing G6P to glucose and phosphate, are shown embedded in the ER membrane.

References

    1. Chou JY, Jun HS, Mansfield BC. Glycogen storage disease type I and G6Pase-beta deficiency: etiology and therapy. Nat Rev Endocrinol. 2010;6(12):676–688. - PMC - PubMed
    1. Boztug K, Appaswamy G, Ashikov A, et al. A syndrome with congenital neutropenia and mutations in G6PC3. N Engl J Med. 2009;360(1):32–43. - PMC - PubMed
    1. McDermott DH, DeRavin SS, Jun HS, et al. Severe congenital neutropenia due to G6PC3 deficiency with increased neutrophil CXCR4 expression and myelokathexis. Blood. 2010;116(15):2793–2802. - PMC - PubMed
    1. Banka S, Chervinsky E, Newman WG, et al. Further delineation of the phenotype of severe congenital neutropenia type 4 due to mutations in G6PC3. Eur J Hum Genet. 2011;19(1):18–22. - PMC - PubMed
    1. Shieh J-J, Pan C-J, Mansfield BC, Chou JY. Glucose-6-phosphate hydrolase, widely expressed outside the liver, can explain age-dependent resolution of hypoglycemia in glycogen storage disease type Ia. J Biol Chem. 2003;278(47):47098–47103. - PubMed

Publication types

MeSH terms

Supplementary concepts