. 2012 Mar 21;31(6):1350-63.
doi: 10.1038/emboj.2011.494. Epub 2012 Jan 13.

Axonal transcription factors signal retrogradely in lesioned peripheral nerve

Affiliations

Axonal transcription factors signal retrogradely in lesioned peripheral nerve

Keren Ben-Yaakov et al. EMBO J. .

Abstract

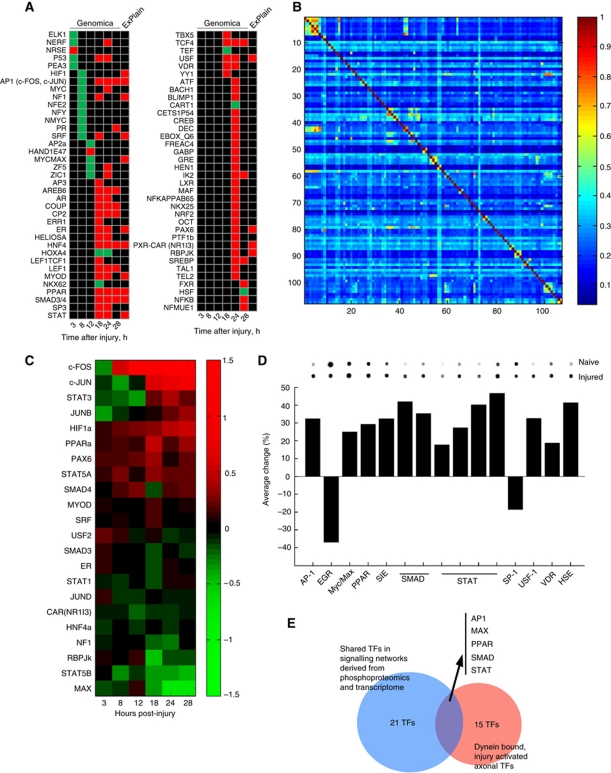
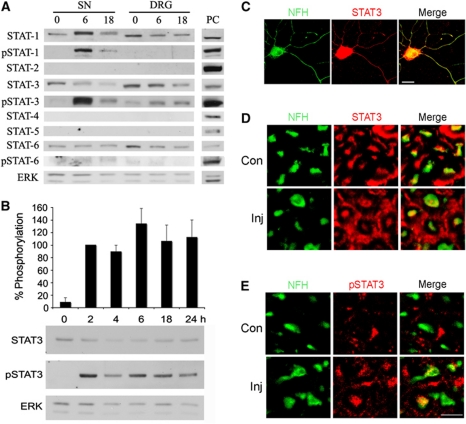
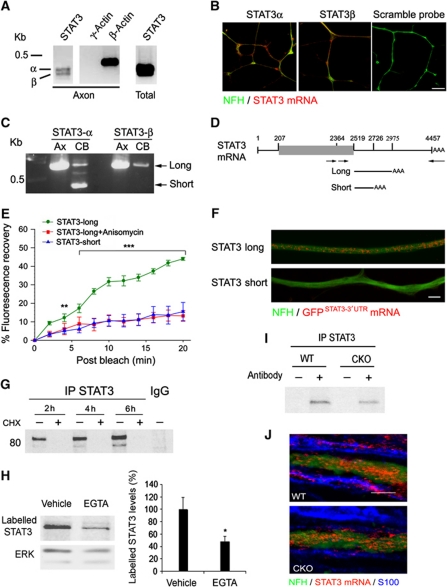
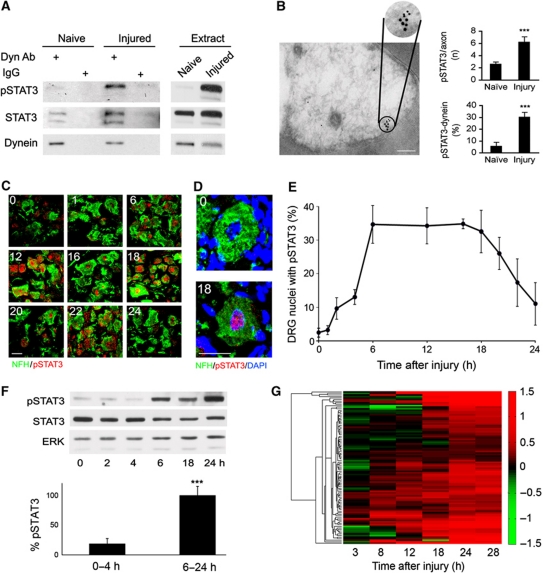
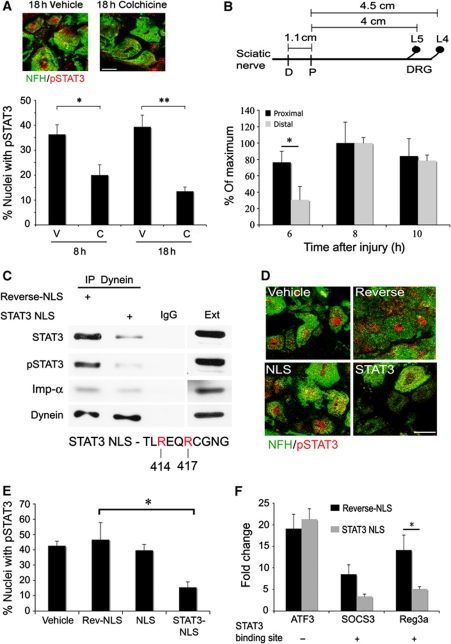
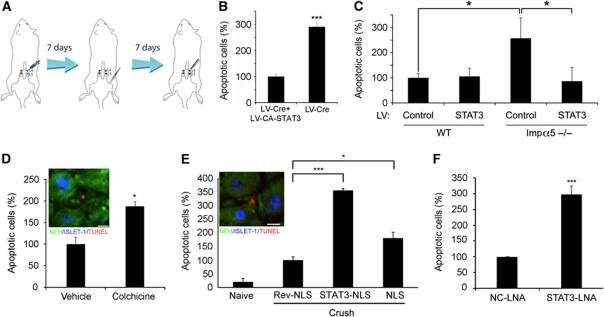
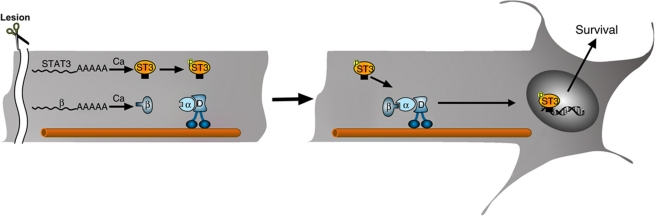
Retrograde axonal injury signalling stimulates cell body responses in lesioned peripheral neurons. The involvement of importins in retrograde transport suggests that transcription factors (TFs) might be directly involved in axonal injury signalling. Here, we show that multiple TFs are found in axons and associate with dynein in axoplasm from injured nerve. Biochemical and functional validation for one TF family establishes that axonal STAT3 is locally translated and activated upon injury, and is transported retrogradely with dynein and importin α5 to modulate survival of peripheral sensory neurons after injury. Hence, retrograde transport of TFs from axonal lesion sites provides a direct link between axon and nucleus.


Conflict of interest statement

The authors declare that they have no conflict of interest.

Figures

Figure 1
Figure 1
Multiple transcription factors in the neuronal injury response. (A) Genomica analyses of transcription factor binding sites (TFBS) enriched in dorsal root ganglion microarray data sets at different time points after sciatic nerve lesion, compared with those found in the ExPlain analyses of Michaelevski et al (2010a, 2010b). Green indicates enrichment in the downregulated gene set, red indicates enrichment in the upregulated gene set, and black indicates no enrichment at that time point. For lists of genes associated with each TFBS, please see Supplementary Table S1. (B) Matrix of TFBS co-occurrence within regulated genes in the microarray data set. Genes containing the 107 enriched TFBS identified by Genomica were scanned for all possible instances of TFBS co-occurrence and the average degree of co-occurrence between all possible pairs is shown. The heat map colour code goes from no co-occurrence (0) to complete co-occurrence (1). Numerical data for the matrix are provided in Supplementary Table S2. (C) Cluster analysis of expression levels of mRNA's encoding transcription factors (TF) found in both Genomica and ExPlain analyses. Expression is shown in log2 values versus the reference time point of 1 h after injury. Colour code for TF mRNA regulation shown on the right. (D) Active (DNA binding) transcription factors co-precipitated with dynein from axoplasm of control or injured sciatic nerve (6 h post injury) quantified by Panomics Protein/DNA array analysis. Percent activity is normalized to hybridization controls on the array, and representative blots for each TF are shown above the graph. Multiple bars for STAT or Smad families represent multiple probes on the array. Complete data for all TFs represented on the array are provided in Supplementary Table S3. (E) Intersection of TFs found in the different screens highlights six families as sources for candidate retrograde injury signals.
Figure 2
Figure 2
Activation of STAT3 in sciatic nerve axons after injury. (A) Western blot analyses of STAT family members in sciatic nerve (SN) axoplasm or DRG extract from control or injured rat SN (6 or 18 h after injury). Only STAT3 is phosphorylated in both SN and DRG after injury. ERK was used as a loading control. PC denotes positive control (HeLa extract for STATs-1-4 and 6; K562 cells extract for STAT-5; HeLa cells were treated with IFNα for pSTAT-1 and -3; or with IL-4 for pSTAT-6). The experiment was repeated four times with similar results. (B) Western blot analysis of 20 μg aliquots of rat sciatic nerve axoplasm from 0 to 24 h post lesion reveals prolonged phosphorylation of STAT3 after injury. ERK was used as a loading control. Quantification is in percentage of pSTAT3 levels at 2 h post lesion (average±s.e.m.; n=5). (C) Immunostaining for STAT3 and the axonal marker NFH on adult rat DRG neurons in culture shows that STAT3 is found in NFH-positive processes. Scale bar 20 μm. (D) Immunostaining for STAT3 and (E) for pSTAT3 on cross-sections of control or injured (6 h post lesion) rat sciatic nerve reveals the presence of STAT3 in NFH-positive axons in vivo and its phosphorylation after injury. Scale bar 10 μm. Figure source data can be found in Supplementary data.
Figure 3
Figure 3
STAT3 message and local translation in axons. (A) RT–PCR reveals the presence of STAT3 transcripts (α and β) in isolated DRG axons as well as in cell bodies. β-Actin and γ-actin transcripts are differentially represented in axons and were used as positive and negative controls, respectively. (B) STAT3 mRNA revealed by in-situ hybridization in processes of cultured DRG neurons. Scale bar 10 μm. (C) Nested PCR of STAT3 3′UTR on axonal and cell body cDNA reveals different 3′UTR variants in the cell body and axons. The major variants subsequently cloned for analysis are indicated by arrows. (D) Schematic of STAT3 transcripts, with open reading frame denoted by the grey box. The lines under the schematic delineate regions subcloned for constructs containing axonal (short) or cell body (long) 3′UTR variants, as indicated in (C). (E) Fluorescence recovery after photobleaching of adult DRG neurons transfected with the indicated constructs. Average recoveries (% of prebleach levels±s.e.m.) are shown (n=6, **P<0.01, ***P<0.005). For representative images, please see Supplementary Figure S3. (F) In-situ hybridization with a GFP riboprobe reveals mRNA for the STAT3-long reporter construct, but not for STAT3-short, in the processes of cultured DRG neurons (scale bar 5 μm). For additional images and quantification of these data, please see Supplementary Figure S4. (GI) Metabolic labelling of sciatic nerve (SN) axoplasm reveals Ca2+-dependent local synthesis of STAT3 in axons. SN segments from rat (G, H) or from STAT3-GFAP-CKO or wild-type (WT) mice (I) were incubated for 2, 4, 6 h (G) or 6 h (H, I) in Met/Cys-deficient DMEM medium containing 40 μCi/ml of [S35]Met/Cys, with or without 10 μg/ml cycloheximide or 100 mM EGTA. EGTA (100 mM) or Vehicle (PBS) was injected to SN before incubation in the medium. Equal samples of axoplasm proteins were then subjected to immunoprecipitation with antibodies against STAT3 or control IgG, followed by gel electrophoresis and autoradiography. Quantification of labelled STAT3 intensity normalized to the loading control ERK is shown in the graph as percent of vehicle treatment (average±s.e.m., n=3, *P<0.05). (J) Fluorescent in-situ hybridization on SN longitudinal sections from wild-type or STAT3-GFAP-CKO mice reveals the presence of STAT3 transcript (red) in NFH (green) positive axons. Note the presence of STAT3 transcript in Schwann cells (blue, identified by immunostaining for S100) in the WT mouse, but not in the CKO mouse (scale bar 5 μm). Figure source data can be found in Supplementary data.
Figure 4
Figure 4
Activated STAT3 interacts with dynein in axons. (A) Co-immunoprecipitation of STAT3 and pSTAT3 with dynein. Anti-dynein or non-relevant control IgGs were used to precipitate rat axoplasm (500 μg) from naive or injured (6 h post lesion) sciatic nerve (n=3). (B) Electron microscopy of immunogold labelling of dynein heavy chain 1 and pSTAT3 in sciatic nerve cross-sections. A representative micrograph from injured nerve (6 h post lesion) is shown on the left (dynein, 15 nm particles; pSTAT3, 10 nm particles; scale bar 0.2 μm). The number of pSTAT3 particles per axon and the percent of pSTAT3 particles adjacent to a dynein particle are quantified on the right (average±s.e.m., n⩾38 axons, ***P<0.001). (CE) Accumulation of pSTAT3 in DRG after SN injury. (C) Sections of L4/L5 DRGs after sciatic nerve crush (indicated time points in hours) were immunostained for the neuronal marker NFH (green) and pSTAT3 (red). Concentration of pSTAT3 in DRG neuronal nuclei peaks at 6–18 h after injury. Scale bar 20 μm. (D) Zoom-in on representative DRG cells from the experiment described in (B) (0 and 18 h time points). DAPI staining of the nucleus is in blue. Note the concentration of pSTAT3 in DRG cell nucleus after lesion. Scale bar 20 μm. (E) Quantification of the experiment described in (B), showing the fraction of DRG neurons with pSTAT3 concentrated in the nucleus at the indicated time points (average±s.e.m., n=3). (F) Western blot analysis of DRG extracts at different time points after SN lesion. Quantification of pSTAT3/STAT3 intensity ratio in the early time points (0–4 h) versus the late time points (6–24 h) is shown in the graph as percentage of maximum (6 h) (average±s.e.m., n=3, ***P<0.005). (G) Microarray expression data for STAT3 responsive genes at different time points after sciatic nerve lesion, shown as a heat map of fold changes (colour code on the right). For a complete list of gene i.d.'s and fold changes, please see Supplementary Table S4. Figure source data can be found in Supplementary data.
Figure 5
Figure 5
Retrograde transport of activated STAT3 after injury. (A) Injection of colchicine (C, 100 μg) 1 cm proximal to the injury site in sciatic nerve (SN) reduced nuclear accumulation of pSTAT3 at the indicated post-injury time points in DRG neurons. Controls were injected with PBS vehicle (V). Quantification as for Figure 4E (average±s.e.m., n=3, *P<0.05, **P<0.01, scale bar 20 μm). (B) Influence of injury site location on the nerve on accumulation of pSTAT3 in DRG neuronal nuclei. The scheme shows average distances between the injury sites in sciatic nerve and the L4/L5 DRGs (D-distal injury, P-proximal injury). The fraction of DRG neurons with pSTAT3 concentrated in the nucleus after sciatic nerve proximal or distal injury is shown as percent of maximum after normalization to the 4-h time point (average±s.e.m., n=3, *P<0.05). (C) In all, 500 μg axoplasm from injured sciatic nerve (6 h) was subjected to dynein immunoprecipitation, in the presence of 50 μg reverse-NLS or STAT3-NLS peptide, followed by western blot analysis with antibodies against STAT3, pSTAT3, importin α, and dynein. Precipitation with an unrelated IgG serves as a control (n=3). For more details on the STAT3-NLS used, please see Supplementary Figure S5. (D, E) Injection of STAT3-NLS peptide to sciatic nerve inhibits accumulation of pSTAT3 in DRG neuronal nuclei after injury. In all, 250 μg of NLS, reverse-NLS, or STAT3-NLS peptide, or PBS vehicle alone, was injected to sciatic nerve, and L4/L5 DRGs were fixed 18 h later. DRG sections were stained for pSTAT3 and NFH, representative pictures are shown in (D) (scale bar 20 μm), and the fraction of DRG cells with concentrated pSTAT3 in the nucleus was quantified as shown in (E) (average±s.e.m., n=3, *P<0.05). (F) RNA was extracted from L4/L5 DRG 18 h after injection of STAT3-NLS or control reverse-NLS peptides to sciatic nerve concomitantly with a crush injury. Control RNA was extracted from the contralateral DRG. The RNA was reverse transcribed and qPCR was performed for the genes of interest. Results are normalized to β-tubulin and presented in fold changes versus control (average±s.e.m., n=3, *P<0.05). Figure source data can be found in Supplementary data.
Figure 6
Figure 6
Axonal STAT3 promotes neuronal survival after nerve injury. (A) Schematic of lentivirus (LV) transduction protocol. A high titre LV of interest was injected to the L4 and L5 DRGs, and the animals were allowed 7 days for recovery and expression of the LV delivered gene product. Then sciatic nerve crush was performed, and 7 days afterwards the L4/L5 DRGs were excised, fixed, sectioned and stained for the neuronal markers NFH and ISLET-1 together with TUNEL staining for monitoring of cell death. (B) Expression of constitutively active (CA) STAT3 in DRG reduces neuronal death after SN injury in mice deprived of STAT3 in DRG. Reduction of STAT3 expression in L4/L5 DRG was achieved using the cre-lox system, by injection of LV expressing Cre recombinase to L4/L5 DRGs of floxed-STAT3 mice as described in (A). Co-infection with CA-STAT3 caused a three-fold reduction in the fraction of apoptotic cells (average±s.e.m., n=6, ***P<0.005). (C) Enhanced neuronal cell death in L4/L5 DRG of importin α5 KO mice is attenuated by LV-mediated expression of CA-STAT3 in the ganglia (average±s.e.m., n=4, *P<0.05). LV-GFP was used as a control. (D) Colchicine (100 μg) injection to rat SN concomitantly with lesion increased the fraction of TUNEL-positive neurons in the L4/L5 DRG 7 days later. Vehicle control is PBS. (E) Effects of injection of 250 μg of NLS, reverse-NLS or STAT3-NLS peptides concomitantly with SN lesion in rat on the fraction of TUNEL-positive neurons in the L4/L5 DRG 7 days later. Insets in (D) and (E) show representative images (scale bar 15 μm). (F) Effects of injection of 0.3 μg anti-STAT3 or negative control (NC) locked nucleic acid (LNA) into sciatic nerve 2 days before and then again concomitantly with lesion, followed by counts of TUNEL-positive neurons in the L4/L5 DRG 7 days afterwards. Similar results were obtained when monitoring cleaved caspase 3 instead of TUNEL (Supplementary Figure S10). Results in (DF) are presented as percentage of the control treatments (average±s.e.m., n⩾3, *P<0.05, ***P<0.005).
Figure 7
Figure 7
A model for STAT3 retrograde signalling after nerve injury. Sciatic nerve injury induces local synthesis of importin β1 (Hanz et al, 2003) and STAT3 (current manuscript) in lesioned sensory axons. The newly synthesized STAT3 is phosphorylated and then links up with the importins–dynein complex for retrograde transport to neuronal cell bodies, where it activates new transcription with survival-promoting consequences.

Comment in

References

    1. Aakalu G, Smith WB, Nguyen N, Jiang C, Schuman EM (2001) Dynamic visualization of local protein synthesis in hippocampal neurons. Neuron 30: 489–502 - PubMed
    1. Abe N, Almenar-Queralt A, Lillo C, Shen Z, Lozach J, Briggs SP, Williams DS, Goldstein LS, Cavalli V (2009) Sunday driver interacts with two distinct classes of axonal organelles. J Biol Chem 284: 34628–34639 - PMC - PubMed
    1. Abe N, Cavalli V (2008) Nerve injury signalling. Curr Opin Neurobiol 18: 276–283 - PMC - PubMed
    1. Alonzi T, Middleton G, Wyatt S, Buchman V, Betz UA, Muller W, Musiani P, Poli V, Davies AM (2001) Role of STAT3 and PI 3-kinase/Akt in mediating the survival actions of cytokines on sensory neurons. Mol Cell Neurosci 18: 270–282 - PubMed
    1. Andreassi C, Zimmermann C, Mitter R, Fusco S, De Vita S, Saiardi A, Riccio A (2010) An NGF-responsive element targets myo-inositol monophosphatase-1 mRNA to sympathetic neuron axons. Nat Neurosci 13: 291–301 - PubMed

Publication types