. 2012 Mar 7;31(5):1231-40.
doi: 10.1038/emboj.2011.489. Epub 2012 Jan 13.

Microvesicles released from microglia stimulate synaptic activity via enhanced sphingolipid metabolism

Affiliations

Microvesicles released from microglia stimulate synaptic activity via enhanced sphingolipid metabolism

Flavia Antonucci et al. EMBO J. .

Abstract

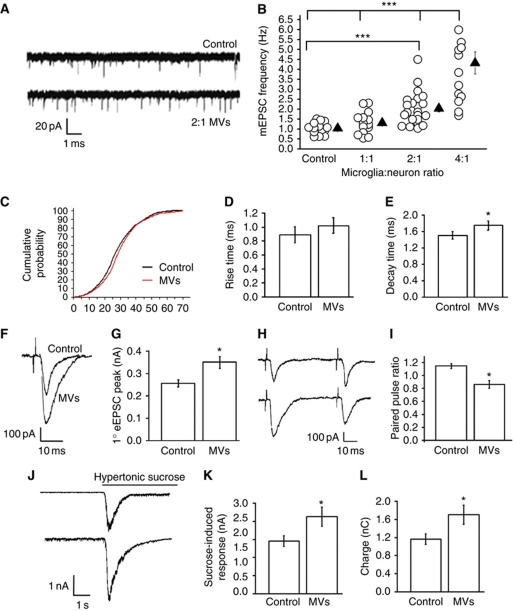
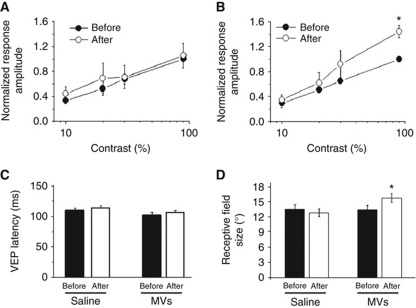
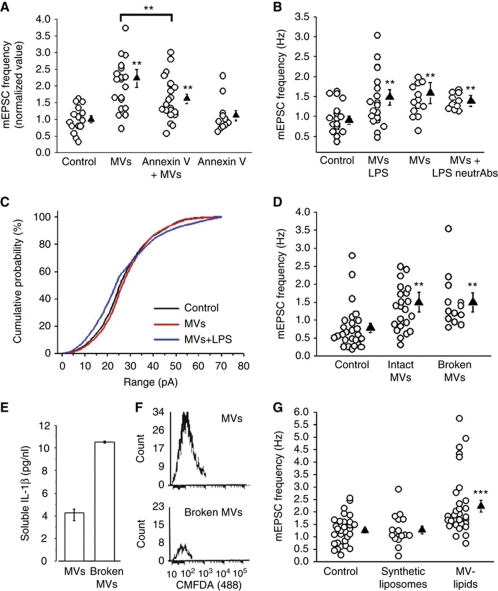
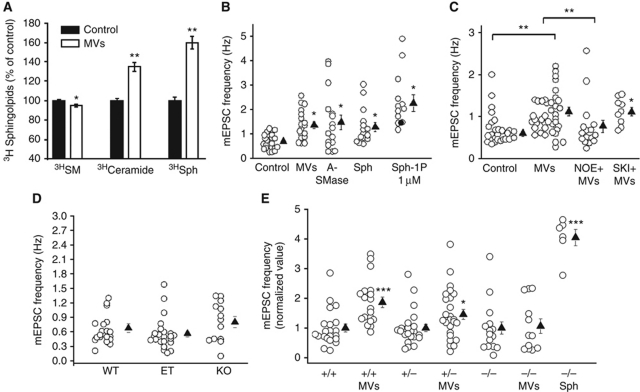
Microvesicles (MVs) released into the brain microenvironment are emerging as a novel way of cell-to-cell communication. We have recently shown that microglia, the immune cells of the brain, shed MVs upon activation but their possible role in microglia-to-neuron communication has never been explored. To investigate whether MVs affect neurotransmission, we analysed spontaneous release of glutamate in neurons exposed to MVs and found a dose-dependent increase in miniature excitatory postsynaptic current (mEPSC) frequency without changes in mEPSC amplitude. Paired-pulse recording analysis of evoked neurotransmission showed that MVs mainly act at the presynaptic site, by increasing release probability. In line with the enhancement of excitatory transmission in vitro, injection of MVs into the rat visual cortex caused an acute increase in the amplitude of field potentials evoked by visual stimuli. Stimulation of synaptic activity occurred via enhanced sphingolipid metabolism. Indeed, MVs promoted ceramide and sphingosine production in neurons, while the increase of excitatory transmission induced by MVs was prevented by pharmacological or genetic inhibition of sphingosine synthesis. These data identify microglia-derived MVs as a new mechanism by which microglia influence synaptic activity and highlight the involvement of neuronal sphingosine in this microglia-to-neuron signalling pathway.


Conflict of interest statement

The authors declare that they have no conflict of interest.

Figures

Figure 1
Figure 1
Effect of MVs on neurotransmission in hippocampal cultures. (A) Representative traces of mEPSCs from control neurons and neurons exposed to MVs. (B) Changes of mEPSC frequency evoked by MVs in a microglia-to-neuron ratio of 1:1 (MVs concentration=1.2 μg/ml), 2:1 (MVs concentration=2.38 μg/ml), and 4:1 (MVs concentration=4.76 μg/ml); N=3; one-way ANOVA followed by Dunn's method, P<0.001. (C) Cumulative distribution of mEPSC amplitude from control and MV-treated neurons; n=15 controls; n=12 MV-treated neurons; t-test followed by Mann–Whitney, P=0.054. (D, E) Rise time (D), t-test followed by Mann–Whitney rank-sum test, P=0.071 and decay time (E), n=10 controls; n=15 MV-treated neurons; test followed by Mann–Whitney, P=0.006 of mEPSCs from control and MV-treated neurons. (F, G) Examples of stimulus-evoked EPSCs in control and MV-treated paired mouse neurons (F) and corresponding mean amplitude (G); t-test P=0.001, N=3, 11 versus 10 pairs, respectively. (H, I) Representative traces of short-term plasticity in paired mouse neurons (H) and quantitative analysis of paired-pulse ratio (I); n=10 pairs per conditions, N=3, t-test followed by Mann–Whitney rank-sum test, P=<0.001. (J) Representative sucrose-evoked responses from control and MV-treated neurons. (K, L) Mean amplitude (nA) and total charge (pC) of sucrose-evoked responses; N=4, n=16 Ctr; n=24 MV-treated cells; current (nA), t-test followed by Mann–Whitney rank-sum test, P=0.025; charge transferred (nC), P=0.042.
Figure 2
Figure 2
MVs increase field potential responses in vivo. (A, B) Contrast threshold curves obtained before and after delivery of saline (A, n=4 rats; two-way repeated measures ANOVA, baseline versus post saline, P=0.84) or MVs (B, n=6 rats) into the visual cortex. The VEP amplitude for each contrast value is normalized to the amplitude of the response at contrast=90% before injection. Note the significant potentiation of the VEP response to 90% contrast gratings following MVs (two-way repeated measures ANOVA followed by Holm–Sidak test, P<0.05). (C) VEP latencies before/after delivery of saline or MVs. Latency of visual response is not affected (paired t-test, P>0.49 for all comparisons) by either treatment. (D) RF sizes before/after delivery of saline or MVs. Note the significant enlargement of RFs following MVs injection (paired t-test, P<0.05), but not after saline injection (paired t-test; MVs, P=0.015 and saline, P=0.68, respectively). Before saline, n=30 cells; after saline n=28 cells; before MVs, n=42 cells; after MVs, n=38 cells.
Figure 3
Figure 3
Surface components of MVs stimulate of exocytosis. (A) Normalized mEPSC frequency of control neurons and neurons exposed to MVs pretreated with annexin-V; N=3, one-way ANOVA followed by Fisher's LSD methods, P<0.001. (B) mEPSC frequency of control neurons and neurons exposed to MVs derived from resting or LPS-primed microglia with or without TNF-α and IL-1β neutralizing Abs; N=3, one-way ANOVA followed by Dunn's test, P=0.003, LPS-MV-treated versus LPS-MVs-treated+neutrAb t-test, P=0.439. (C) Cumulative distribution of mEPSC amplitudes as in (B). (D) mEPSC frequency from control neurons, neurons exposed to intact or empty N9-MVs, broken by freeze and thaw; N=3, one-way ANOVA followed by Dunn's test, P=0.002. (E) MVs shed from LPS-primed N9 in saline were subjected or not to freeze and thaw. The histogram shows the concentration of IL-1β detected by ELISA in the saline containing intact MVs or broken MVs. (F) Flow cytometry plots for CMFDA of intact and broken MVs. (G) Rate of mEPSCs recorded from control neurons and neurons exposed to either artificial liposomes or native lipids from MVs; N=3, one-way ANOVA followed by Dunn's methods, P=0.002.
Figure 4
Figure 4
MVs stimulate sphingolipid synthesis in neurons. (A) A-SMase activity of MVs and of donor N9 cells. Values were normalized to protein concentration of equivalent amounts of MVs and N9. Cells were pulsed 1 h with [Sph-3H]SM followed by 1 h chase with or without MVs. Cell lipids were extracted and analysed as described in Supplementary data. Data are expressed as % of control. (B) Neurons were exposed to bacterial A-SMase (2 U), Sph (1 μM) or S-1P (1 μM) for 30 min, washed and mEPSCs were recorded for the subsequent 45 min. The graph shows mEPSC frequency under above conditions; N=3 for A-SMase and Sph, N=2 for S-1P; one-way ANOVA followed by Fisher's methods, P=0.014. (C) Rate of mEPSCs of control and MV-treated neurons with or without NOE and SKI-1; N=3; Ctr versus MVs treated, one-way ANOVA followed by Fisher's methods, P<0.001. (D) Rate of mEPSCs of hippocampal neurons established from WT, heterozygous or A-SMase KO mice; N=3, Kruskal–Wallis one-way ANOVA on ranks, P=0.085. (E) mEPSC frequency (normalized data) of WT, heterozygous and KO A-SMase neurons exposed or not to MVs produced by primary microglia or Sph (1 μM); N=3, +/+A-SMase versus +/+A-SMase+MVs: t-test followed by Mann–Whitney rank-sum test, P<0.001; +/−A-SMase versus +/−A-SMase +MVs t-test followed by Mann—Whitney, P=0.026; −/−A-SMase versus −/−A-SMase +MVs: t-test, P=0.981.

Similar articles

Cited by

References

    1. Akira S, Takeda K (2004) Toll-like receptor signalling. Nat Rev Immunol 4: 499–511 - PubMed
    1. Al-Nedawi K, Meehan B, Micallef J, Lhotak V, May L, Guha A, Rak J (2008) Intercellular transfer of the oncogenic receptor EGFRvIII by microvesicles derived from tumour cells. Nat Cell Biol 10: 619–624 - PubMed
    1. Al-Nedawi K, Meehan B, Rak J (2009) Microvesicles: messengers and mediators of tumor progression. Cell Cycle 8: 2014–2018 - PubMed
    1. Bacci A, Coco S, Pravettoni E, Schenk U, Armano S, Frassoni C, Verderio C, De Camilli P, Matteoli M (2001) Chronic blockade of glutamate receptors enhances presynaptic release and downregulates the interaction between synaptophysin-synaptobrevin-vesicle-associated membrane protein 2. J Neurosci 21: 6588–6596 - PMC - PubMed
    1. Barenholz Y, Gibbes D, Litman BJ, Goll J, Thompson TE, Carlson RD (1977) A simple method for the preparation of homogeneous phospholipid vesicles. Biochemistry 16: 2806–2810 - PubMed

Publication types