. 2012 Mar 7;31(5):1080-94.
doi: 10.1038/emboj.2011.492. Epub 2012 Jan 13.

Oxidative stress induces an ATM-independent senescence pathway through p38 MAPK-mediated lamin B1 accumulation

Affiliations

Oxidative stress induces an ATM-independent senescence pathway through p38 MAPK-mediated lamin B1 accumulation

Aurelia Barascu et al. EMBO J. .

Abstract

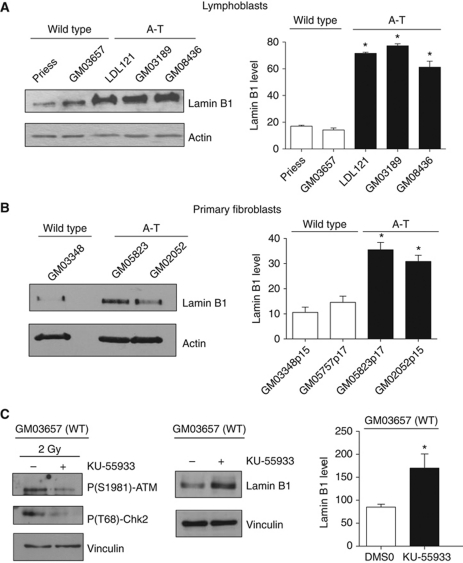
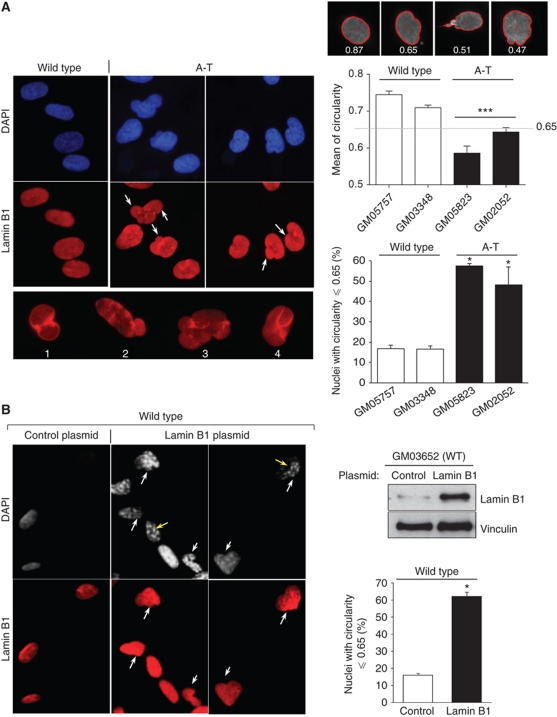
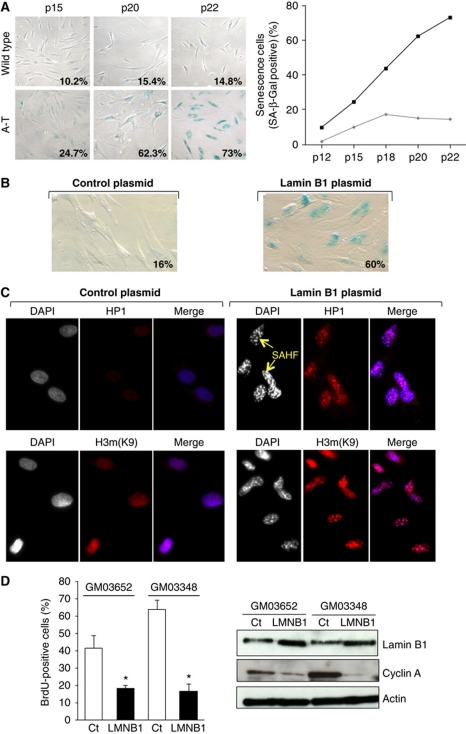
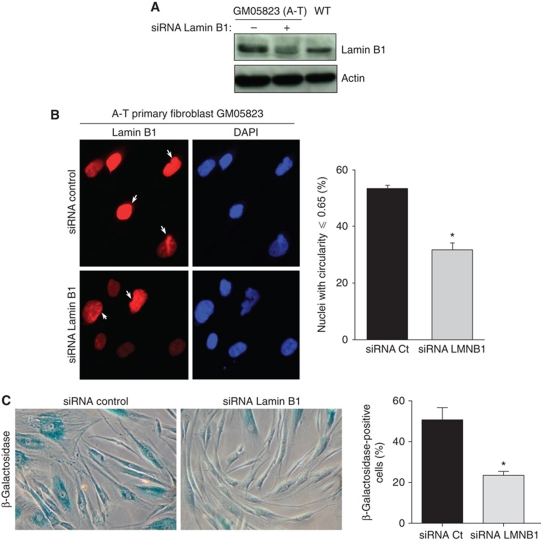
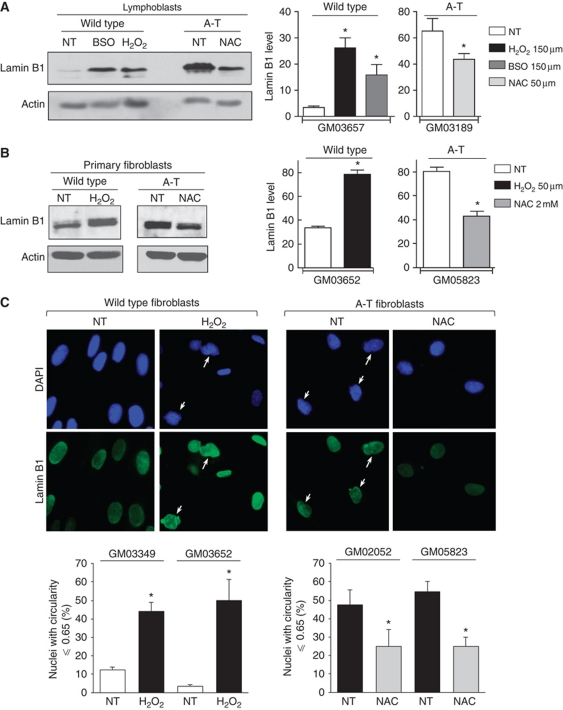
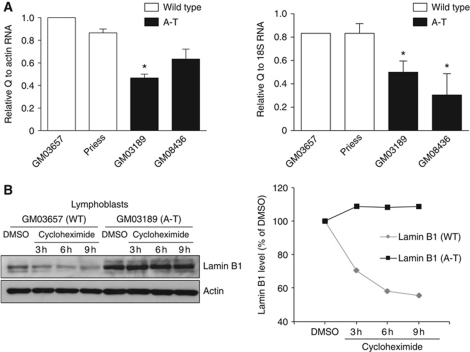
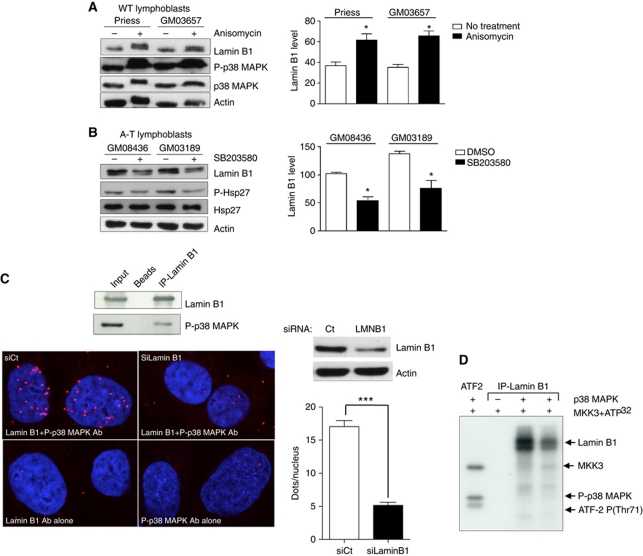
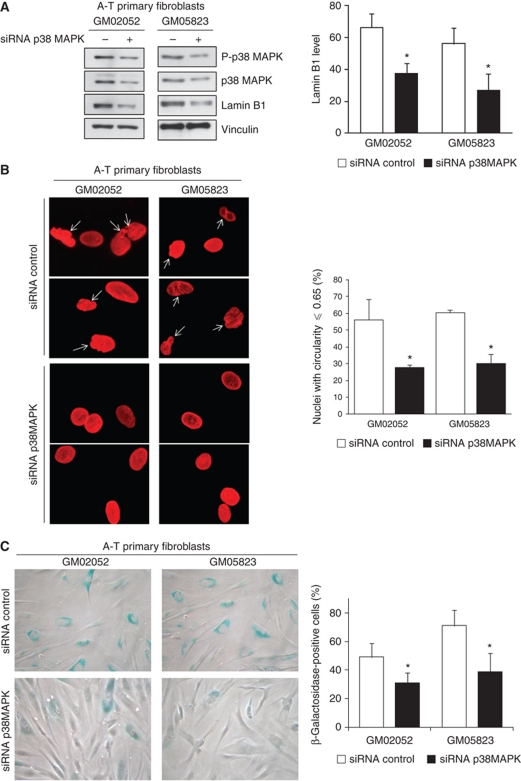
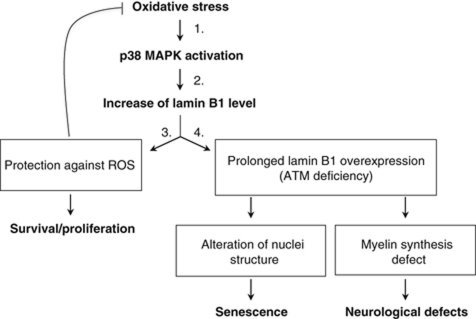
We report crosstalk between three senescence-inducing conditions, DNA damage response (DDR) defects, oxidative stress (OS) and nuclear shape alterations. The recessive autosomal genetic disorder Ataxia telangiectasia (A-T) is associated with DDR defects, endogenous OS and premature ageing. Here, we find frequent nuclear shape alterations in A-T cells, as well as accumulation of the key nuclear architecture component lamin B1. Lamin B1 overexpression is sufficient to induce nuclear shape alterations and senescence in wild-type cells, and normalizing lamin B1 levels in A-T cells reciprocally reduces both nuclear shape alterations and senescence. We further show that OS increases lamin B1 levels through p38 Mitogen Activated Protein kinase activation. Lamin B1 accumulation and nuclear shape alterations also occur during stress-induced senescence and oncogene-induced senescence (OIS), two canonical senescence situations. These data reveal lamin B1 as a general molecular mediator that controls OS-induced senescence, independent of established Ataxia Telangiectasia Mutated (ATM) roles in OIS.


Conflict of interest statement

The authors declare that they have no conflict of interest.

Figures

Figure 1
Figure 1
Increase of lamin B1 levels in A-T cells. Western blot analysis of extracts (A) from wild-type (WT) and A-T lymphoblasts and (B) from WT (GM03348 p15) and A-T primary fibroblasts (GM05823 p17 and GM02052 p15). Right panels: quantification of lamin B1 levels relative to actin. (C) Increase of lamin B1 after ATM inhibition. WT lymphoblasts were treated for 24 h with DMSO or 10 μM KU-55933, a specific ATM inhibitor. Left panel: control of inhibitor efficiency by western blot analysis of ATM activity using the ATM-P(S1981) and Chk2-P(T68) antibodies, after irradiation at 2 Gy. Right panel: the western blot analysis and quantification (histogram) show an increase of lamin B1 levels in WT lymphoblasts (GM03657) after 24 h of KU-55933 treatment. All quantification values correspond to at least three independent experiments. *Represents a statistically significant difference (P<0.05) between the values for WT and A-T cells or between untreated and treated cells. The error bars denote the s.e.m.
Figure 2
Figure 2
Frequency of mishappen nuclei in A-T cells and lamin B1-overexpressing cells. (A) The nuclear shapes of WT (GM05757, p17; GM03348, p15) and A-T (GM02052, p15; GM05823, p17) human primary fibroblasts examined by immunofluorescence with anti-lamin B1 (red) and DAPI (blue) (left panels). White arrows and lower panels show examples of alterations in nuclear morphology; nuclear envelope lobulations (1), nuclear blebbing (2 and 3), or crumpled nuclei (4) were observed in A-T cells. Right panels: analysis of nuclear circularity with Cellprofiler software. The upper panels show examples of values of circularity for the normal nucleus shape (left) and abnormal nuclear shapes (middle and right). The red line indicates the cell contour determined by the software. This analysis indicates that all nuclei with a circularity value ⩽0.65 have an abnormal shape. Middle panel: mean circularity in two WT and two AT primary fibroblast populations from three independent experiments. At least 100 nuclei were analysed. The values correspond to means from three independent experiments. ***Represents P<0.0001 (t-test). The error bars denote the s.e.m. Lower panel: percentage of cells with deformed nuclei (circularity ⩽0.65) from three independent experiments. (B) Abnormal shapes of nuclei in WT cells overexpressing lamin B1. Human wild-type (GM03652, p15) primary fibroblasts transfected with a lamin B1 expression vector compared with cells transfected with an empty expression vector (control) 48 h after transfection. Nuclear shape was determined as in (A) by immunofluorescence with anti-lamin B1 (red) and DAPI (grey). Yellow arrows show cells with senescence-associated heterochromatin foci (SAHF). Right upper panel: western blot of lamin B1 and actin on extract from wild-type primary fibroblasts transfected with the control or lamin B1 plasmid. Right lower panel: the values on the histogram correspond to the percentage of nuclei with circularity ⩽0.65 from three independent experiments. Nuclear shape analysis was performed on at least 100 cells per condition. *Represents a statistically significant difference (P<0.05). The error bars denote the s.e.m.
Figure 3
Figure 3
Lamin B1 overexpression induces senescence in primary fibroblasts. (A) Accelerated senescence in A-T cells. SA-β-galactosidase expression in WT (GM03652) and A-T (GM02052) primary fibroblasts as a function of passage. Representative photomicrographs of WT and A-T cells at the same magnification are shown. Right panel: quantification of SA-β-gal expression in WT (GM03652, grey diamonds) versus A-T (GM02052, black square) primary fibroblasts are shown. (B) SA-β-gal assay performed on WT primary fibroblasts (GM03652 at passage 15) 48 h after transfection of the control plasmid (left panels) or the lamin B1 plasmid (right panels). (C) Senescence-associated heterochromatin foci (SAHF) formation. The cells were stained 48 h after transfection. Yellow arrows: representative examples of SAHF. The merge shows an accumulation of HP1 and H3mK9 staining in condensed chromatin. (D) Effect of lamin B1 overexpression on BrdU incorporation. WT primary fibroblasts were transfected with an empty expression vector (Ct) or a lamin B1 expressing vector (LMNB1). Forty-eight hours following transfection, the cells were incubated for 24 h with 10 μM BrdU. The histogram represents the quantification of BrdU-positive cells. The values correspond to the means from three independent experiments. *Represents a statistically significant difference (P<0.05). Right panels: proteins were extracted 48 h after transfection and lamin B1, cyclin A and actin were detected by immunoblotting.
Figure 4
Figure 4
Reduction of the lamin B1 levels rescues nuclear shape alteration and senescence in A-T primary fibroblasts. (A) Western blot analysis of lamin B1 in extract from A-T primary fibroblasts transfected with control or lamin B1 siRNA (20 nM). (B) The alterations in nuclear shape in A-T human primary fibroblasts transfected with control or lamin B1 siRNA were examined by immunofluorescence with anti-lamin B1 (red) and DAPI (blue) 72 h following transfection (left panel). Right panel: % of misshapen nuclei (circularity ⩽0.65) from three independent experiments. Nuclear shape analysis was performed on at least 100 cells per condition. (C) The SA-β-gal assay was performed on A-T human primary fibroblasts (GM05823) 72 h after transfection with control or lamin B1 siRNA. Histograms represent the quantification of SA-β-gal-positive cells from more than five randomly chosen fields (× 10 magnification). *Represents a statistically significant difference (P<0.05). Error bars denote the s.e.m.
Figure 5
Figure 5
Effect of oxidative stress on lamin B1 levels and nuclear morphology. (A) WT and A-T lymphoblasts were treated with H2O2 or BSO and NAC, respectively. (B) WT and A-T primary fibroblasts were treated with H2O2 and NAC, respectively. Upper right panels: quantification of lamin B1 levels relative to actin following treatment. The values correspond to the means of three to eight independent experiments. *Represents a statistically significant difference (P<0.05) between untreated (NT) and treated cells. The error bars denote the s.e.m. (C) Impact of oxidative stress on nuclear shape. Upper panels: WT and A-T fibroblasts were treated with H2O2 and NAC, respectively, for 72 h and analysed by immunofluorescence with anti-lamin B1 (green) and DAPI (blue). White arrows: alterations in nuclear morphology (white arrows). Lower panels: quantification of abnormal nuclei. Means from three separate experiments are expressed after H2O2 treatment in wild-type primary fibroblasts (GM03349 p14 and GM03652 p14, left panel) and after NAC treatment in A-T primary fibroblasts (GM2052 p14 and GM05823 p18, right panel). At least 150 cells were counted per group. *Represents a statistically significant difference (P<0.05) between untreated (NT) versus treated cells. The error bars denote the s.e.m.
Figure 6
Figure 6
Expression and stability of lamin B1 in WT versus A-T cells. (A) mRNA levels by real-time PCR quantification. A parallel amplification using the ACTIN and 18S rRNA primers was carried out as a reference. The values correspond to the means from three independent experiments. *Represents a statistically significant difference (P⩽0.05). Error bars denote the s.e.m. (B) The stability of lamin B1 in WT (GM03657) versus A-T (GM03189) cells was analysed by western blot after 3, 6 or 9 h of 50 μg/ml cycloheximide treatment.
Figure 7
Figure 7
Impact of p38 MAPK on lamin B1 levels and interactions between p38 MAPK and lamin B1. Modifications of lamin B1 levels after anisomycin (A) or SB203580 (B) treatment. Left panels: western blot analysis after 24 h of anisomycin (10 μg/ml) or SB203580 (10 μM) treatment. Right panels: quantification of lamin B1 after anisomycin (A) or SB203580 (B) treatment. Immunoblotting of P(T180-Y182)-p38 MAPK and P-(Ser82)-Hsp27 protein, a substrate of p38 MAPK, was performed to confirm the efficiency of anisomycin and inhibitor SB203580, respectively, on p38 MAPK activity. (C) Upper panel: co-immunoprecipitation of lamin B1 (overexpressed 48 h before protein extraction) and endogenous P-p38 MAPK. Lower panels: in-situ interactions between endogenous lamin B1 and activated p38 MAPK monitored by the proximity ligation assay (PLA) using the anti-P(T180/Y182)-p38 MAPK and lamin B1 (bottom panel) antibodies. Proximal locations between the two proteins were observed as red fluorescent dots. Right upper panel: a western blot showing the efficiency of lamin B1 siRNA 48 h after treatment. Right lower panel: quantification of in-situ PLA in cells transfected with negative control siRNA (siCtrl) or with lamin B1 siRNA (siLMNB1). Each value represents the mean number of dots in >155 nuclei. *Represents a statistically significant difference (P<0.05). ***Represents P<0.0001 (t-test). The error bars denote the s.e.m. (D) In-vitro phosphorylation of lamin B1 by p38 MAPK on SV-40 fibroblasts. The kinase activity of p38 MAPK on immunoprecipitated lamin B1 protein from two WT lymphoblasts protein extracts (Priess and GM03657) was evaluated by a radioactive assay. In the presence of MKK3 (a p38 MAPK activator) and 32PATP, p38 MAPK phosphorylated lamin B1 in vitro (lanes 3 and 4). In the first lane, ATF2-P(T71), a specific substrate of p38 MAPK, served as a positive control of p38 MAPK activity. In the second lane, no lamin B1 phosphorylation was detected in the absence of p38 MAPK.
Figure 8
Figure 8
Impact of silencing p38 MAPK in A-T primary fibroblasts. (A) Impact of siRNA p38 MAPK (40 nM) on lamin B1 levels. Left panel: western blot analysis. Right panels: quantification of lamin B1 levels after treatment. The values correspond to the means from three independent experiments. *Represents a statistically significant difference (P<0.05) between control and p38 MAPK siRNA-treated cells. Error bars denote the s.e.m. (B) Impact on nuclear shape. Left panels: nuclear shape of A-T fibroblasts that were treated for 72 h with control and p38 MAPK siRNA and analysed by immunofluorescence with anti-lamin B1 (red). Right panel: quantification of abnormal nuclei: circularity ⩽0.65 (white arrows). The data are the means from three independent experiments. At least 150 cells were counted per group. *Represents a statistically significant difference (P<0.05). The error bars denote the s.e.m. (C) Impact on senescence in A-T primary fibroblasts. SA-β-galactosidase expression in A-T primary fibroblasts was analysed 72 h after siRNA transfection. Left panels: representative photomicrographs. Right panel: quantification of SA-β-gal expression following control or p38 MAPK siRNA treatment. SA-β-gal-positive cells were quantified from more than five randomly chosen fields (× 10 magnification). The mean values from three separate experiments are presented. *Represents a statistically significant difference (P<0.05) between the control and p38 MAPK siRNA-treated cells. Error bars denote the s.e.m.
Figure 9
Figure 9
Consequences of lamin B1 accumulation on redox balance, senescence and neurological defects. Oxidative stress leads to an increase of levels of lamin B1 through activation of p38 MAPK. Our data show an important role for lamin B1 protein in the control of oxidative stress, by regulating the ROS levels and improving cell viability. In case of persistent oxidative stress (such as in A-T cells), prolonged accumulation of lamin B1 levels leads to senescence and/or neurological defects. Indeed, lamin B1 can impact on nuclear architecture morphology and senescence, as shown in the present report, as well as on myelin gene synthesis as it was reported in Lin and Fu (2009).

Comment in

References

    1. Bartek J, Bartkova J, Lukas J (2007) DNA damage signalling guards against activated oncogenes and tumour progression. Oncogene 26: 7773–7779 - PubMed
    1. Bartkova J, Rezaei N, Liontos M, Karakaidos P, Kletsas D, Issaeva N, Vassiliou LV, Kolettas E, Niforou K, Zoumpourlis VC, Takaoka M, Nakagawa H, Tort F, Fugger K, Johansson F, Sehested M, Andersen CL, Dyrskjot L, Orntoft T, Lukas J et al. (2006) Oncogene-induced senescence is part of the tumorigenesis barrier imposed by DNA damage checkpoints. Nature 444: 633–637 - PubMed
    1. Barzilai A, Biton S, Shiloh Y (2008) The role of the DNA damage response in neuronal development, organization and maintenance. DNA Repair (Amst) 7: 1010–1027 - PubMed
    1. Barzilai A, Rotman G, Shiloh Y (2002) ATM deficiency and oxidative stress: a new dimension of defective response to DNA damage. DNA Repair (Amst) 1: 3–25 - PubMed
    1. Biton S, Barzilai A, Shiloh Y (2008) The neurological phenotype of ataxia-telangiectasia: solving a persistent puzzle. DNA Repair (Amst) 7: 1028–1038 - PubMed

Publication types

Substances