. 2012 Feb 15;188(4):1933-41.
doi: 10.4049/jimmunol.1101098. Epub 2012 Jan 13.

Defective CD8 T cell responses in aged mice are due to quantitative and qualitative changes in virus-specific precursors

Affiliations

Defective CD8 T cell responses in aged mice are due to quantitative and qualitative changes in virus-specific precursors

Vilma Decman et al. J Immunol. .

Abstract

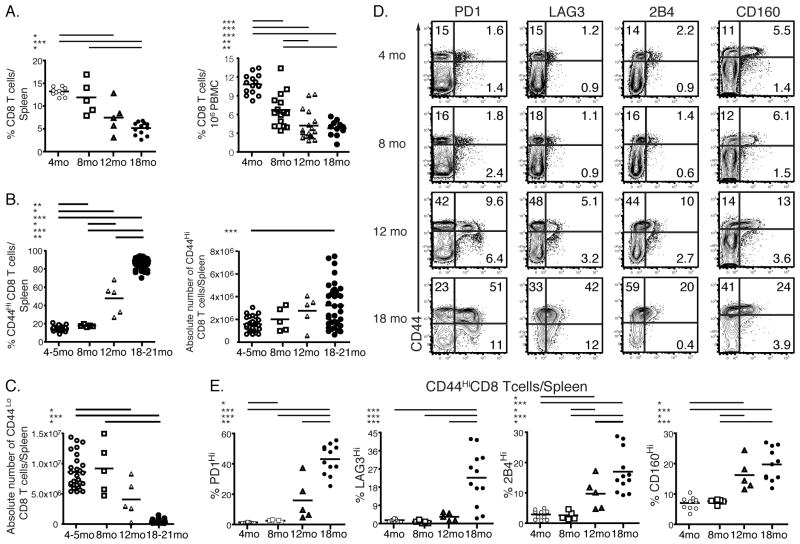
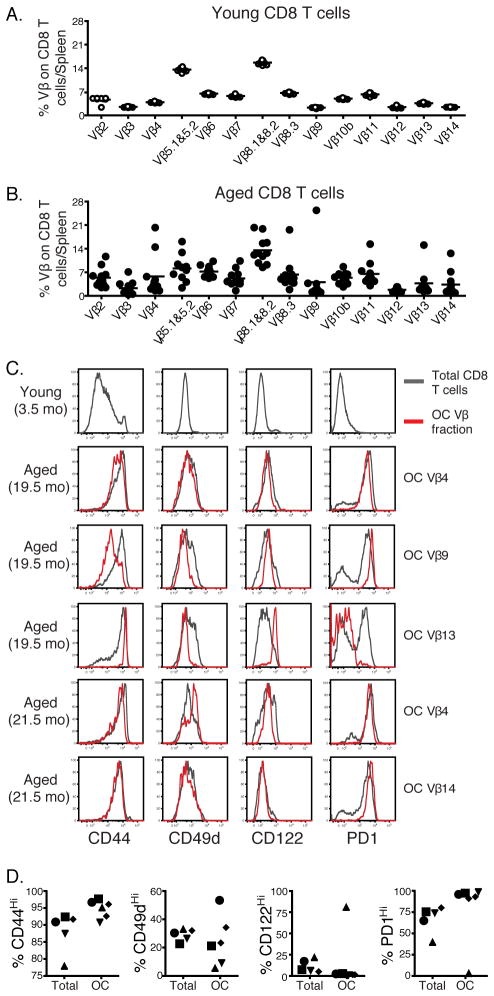
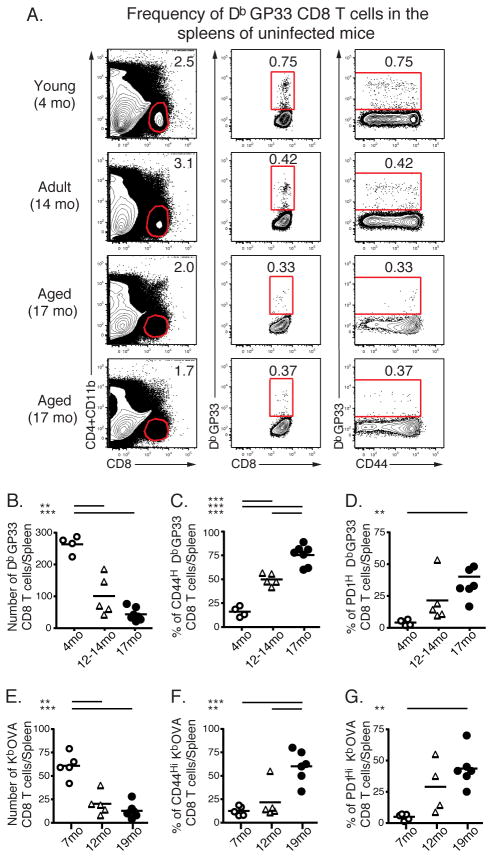
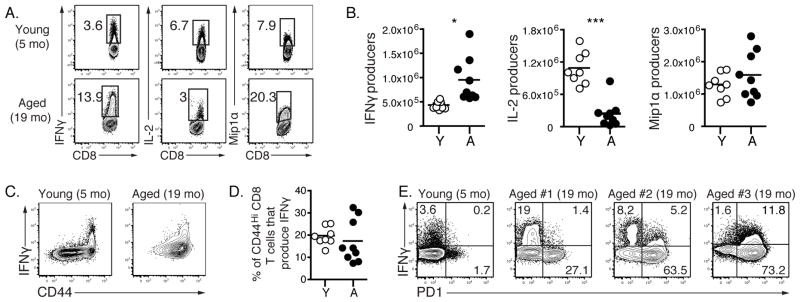
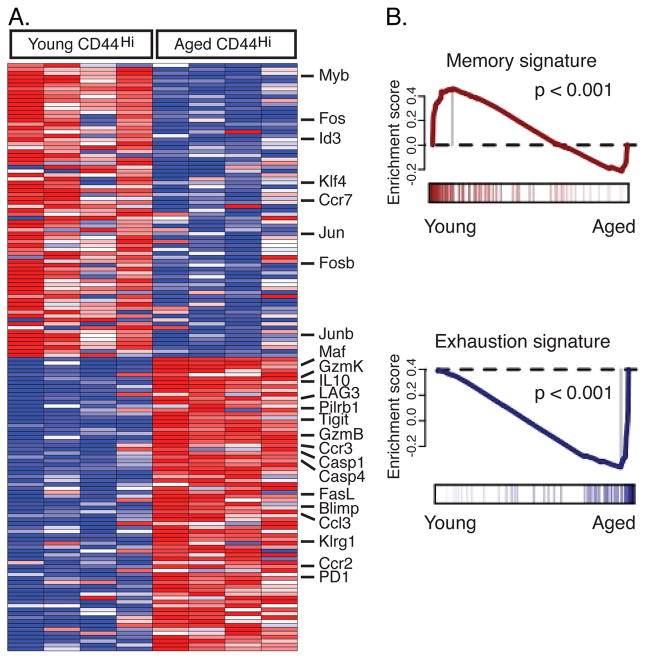
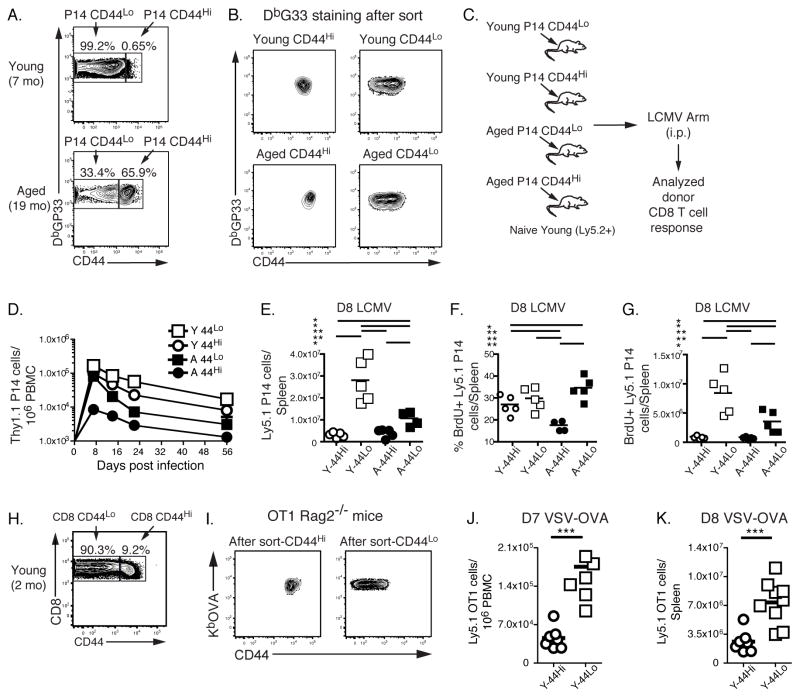
Aging is associated with suboptimal CD8 T cell responses to viral infections. It is not clear whether these poor responses are due to environmental influences or quantitative and qualitative changes in the pool of responding CD8 T cells. Our studies demonstrated several deleterious age-related changes in the pool of Ag-specific CD8 T cells that respond to infection. The majority of CD8 T cells from uninfected aged mice was CD44(Hi) and had increased expression of inhibitory receptors including PD1, LAG3, 2B4, and CD160. These aged CD44(Hi) CD8 T cells were transcriptionally similar to exhausted CD8 T cells found during chronic infections. In addition, the number of virus-specific precursors in aged mice prior to infection was decreased up to 10-fold, and many of these Ag-specific precursors had high expression of CD44 and PD1. Finally, TCR transgenic studies demonstrated that the CD44(Hi) Ag-specific CD8 T cells from unimmunized aged and young mice were qualitatively inferior compared with CD44(Lo) CD8 T cells from aged or young donors. Thus, a decrease in precursor frequency as well as qualitative changes of CD8 T cells during aging are directly related to impaired immunity.


Figures

FIGURE 1
FIGURE 1
Age-associated changes in CD8 T cells. Frequencies of CD8 T cells were analyzed in the spleens and blood of uninfected mice at 4, 8, 12 and 18 months of age (A). The percentages and numbers of CD44Hi and CD44Lo CD8 T cells in the spleens of uninfected mice at age of 4, 8, 12 and 18 months are shown in B and C, respectively. CD8 T cells were isolated from uninfected young and aged spleens at 4, 8, 12 and 18 months of age and stained for the expression of inhibitory receptors PD1, LAG3, 2B4 and CD160. The representative graphs of individual stains of CD8 T cells from spleen are shown in D. The percentages of different inhibitory receptors on CD44Hi CD8 T cells from spleens are shown in E. 1.48 ± 0.09% (Mean ± SEM) of CD44Hi CD8 T cells in the spleens of 4 months old mice are PD1 positive compared to 2.58 ± 0.33%, 15.93 ± 6.12%, 43.18 ± 2.81% of PD1 positive CD44Hi CD8 T cells from the spleens of 8, 12 and 18 months old mice, respectively. Data are representative of 2 independent experiments including 12–20 mice/experiment. Some data are representative of several pooled experiments * = 0.05 > P > 0.01, ** = 0.01 > P > 0.001, *** = P < 0.001 by unpaired two-tailed t test.
FIGURE 2
FIGURE 2
The increase in the inhibitory receptors on CD8 T cells from aged mice is not due exclusively to oligoclonal expansions. CD8 T cells were isolated from spleens of uninfected young (4 months old, white circles) and aged (20–21 months old, black circles) mice and were stained for panel of different Vβ receptors. The percentages of different Vβ populations on young and aged naïve CD8 T cells are shown in panels A and B, respectively. A clonal expansion was defined as at least 3 standard deviations above the mean Vβ use in young mice. Panel C shows histograms of different markers on total or oligoclonally expanded population of CD8 T cells from one young and several aged mice. Panel D shows the percentages of expression of the same markers as shown in C on total and oligoclonally expanded cells. Data are representative of 2 independent experiments including 10 mice/experiment. * = 0.05 > P > 0.01, ** = 0.01 > P > 0.001, *** = P < 0.001 by unpaired two-tailed t test.
FIGURE 3
FIGURE 3
Age-related changes in antigen-specific CD8 T cell precursor numbers and phenotype in naïve mice. Spleens of uninfected mice at 4, 7, 12, 14, 17 and 19 months of age were stained with DbGP33- or KbOVA- tetramers. Representative staining for DbGP33-specific precursors are shown in A. The absolute numbers of naïve DbGP33-specific precursors at different ages are shown in B. C and D show the percent of expression of CD44 and PD1 on DbGP33-specific precursors, respectively. The absolute numbers of naïve KbOVA-specific precursors at different ages are shown in E. F and G show the percent of expression of CD44 and PD1 on KbOVA-specific precursors, respectively. Data are from two independent experiments and are displayed as the pooled results from both. * = 0.05 > P > 0.01, ** = 0.01 > P > 0.001, *** = P < 0.001 by unpaired two-tailed t test.
FIGURE 4
FIGURE 4
Functional changes of naïve T cells during aging. CD8 T cells were isolated from the spleens of uninfected young (4–5 months old) and aged (19–20 months old) mice. Splenocytes were stimulated in vitro using anti-CD3 and anti-CD28 antibodies. 5 hours later cells were stained for the production of different cytokines. The representative graphs for IFNγ, IL-2 and Mip1α staining are shown in A. Graphs in B show absolute numbers of young and aged naïve CD8 T cells that produce IFNγ, IL-2 and Mip1α. Representative plots of CD8 T cells show IFNγ production versus CD44 expression (C). The percentages of CD44Hi CD8 T cells that produce IFNγ are shown in D. E is gated on CD8 T cells from young and aged mice and shows IFNγ versus PD1 expression. Data are representative of 2 independent experiments including 8–9 mice/experiment. * = 0.05 > P > 0.01, ** = 0.01 > P > 0.001, *** = P < 0.001 by unpaired two-tailed t test.
FIGURE 5
FIGURE 5
The transcriptional profiles of CD44Hi CD8 T cells from uninfected aged mice indicate a signature similar to that of exhausted CD8 T cells. CD8 T cells were isolated from spleens of uninfected young (4 months old) and aged (20–21 months old) mice and sorted based on CD44 expression. RNA was isolated and hybridized to the Affymetrix GeneChip Mouse Exon 1.0 ST arrays. ClassNeighbors analysis was performed to identify genes that differentiate CD44Hi CD8 T cells from uninfected young and aged mice (n=4 for each set, A). To evaluate the global similarity to previously defined signatures of CD8 T cell memory and exhaustion we performed Gene Set Enrichment Analysis (GSEA) of CD44Hi CD8 T cells from uninfected young and aged mice (B). There is a clear enrichment of the exhaustion signature in the aged CD44Hi CD8 T cell samples, P < 0.001. There is a corresponding bias of a similarly defined memory signature toward the young CD44Hi CD8 T cell samples, P < 0.001.
FIGURE 6
FIGURE 6
Poor responsiveness of antigen-specific CD44Hi CD8 T cells from uninfected aged and young mice. P14 (DbGP33-specific) CD8 T cells were purified from uninfected young and aged P14 mice (Ly5.1+) and sorted based on the expression of CD44 (A). B shows DbGP33 tetramer staining on sorted P14 populations. After sort, equal numbers of young and aged CD44Hi and CD44Lo P14 cells were transferred into recipient mice (Ly5.2+). Recipient mice were then challenged i.p. with LCMV (2×10⁵ pfu/mouse, C). The responses of the donor P14 CD8 T cells were monitored in the blood (D) and spleens (day 8 p.i, E-G) of recipient mice. Lower frequencies of CD44Hi P14 CD8 T cells derived from aged and young donors were observed compared to their CD44Lo counterparts. Panels E and F, show the absolute number and frequency of BrdU+ donor P14 CD8 T cells derived from young and aged CD44Hi and CD44Lo cells in the spleens of recipient mice at day 8 p.i. In these experiments, twelve hours preanalysis, mice were injected with BrdU i.p. Data are representative of 2 independent experiments including 4–5 mice/experiment. Similarly OT1 (KbOVA-specific) CD8 T cells were purified from uninfected young OT1 Rag2−/− mice (Ly5.1+) and sorted based on the expression of CD44 (H). I shows KbOVA tetramer staining on sorted OT1 populations. After sort, equal numbers of young CD44Hi and CD44Lo OT1 cells were transferred into recipient mice (Ly5.2+). Recipient mice were then challenged i.v. with VSV-OVA (2×10⁶ pfu/mouse). The responses of the donor OT1 CD8 T cells were monitored in the blood (day 7 p.i., J) and spleens (day 8 p.i, K) of recipient mice. Lower numbers of CD44Hi OT1 CD8 T cells (white circles) were observed compared to CD44Lo OT1 CD8 T (white squares). * = 0.05 > P > 0.01, ** = 0.01 > P > 0.001, *** = P < 0.001 by unpaired two-tailed t test.

References

    1. Effros RB. Telomerase induction in T cells: a cure for aging and disease? Exp Gerontol. 2007;42:416–420. - PMC - PubMed
    1. Maue AC, Yager EJ, Swain SL, Woodland DL, Blackman MA, Haynes L. T-cell immunosenescence: lessons learned from mouse models of aging. Trends Immunol. 2009;30:301–305. - PMC - PubMed
    1. Linton PJ, Dorshkind K. Age-related changes in lymphocyte development and function. Nat Immunol. 2004;5:133–139. - PubMed
    1. Dicarlo AL, Fuldner R, Kaminski J, Hodes R. Aging in the context of immunological architecture, function and disease outcomes. Trends Immunol. 2009;30:293–294. - PubMed
    1. Weng NP. Aging of the immune system: how much can the adaptive immune system adapt? Immunity. 2006;24:495–499. - PMC - PubMed

Publication types

MeSH terms

Substances