

Mutant p63 causes defective expansion of ectodermal progenitor cells and impaired FGF signalling in AEC syndrome
- PMID: 22247000
- PMCID: PMC3376849
- DOI: 10.1002/emmm.201100199
Mutant p63 causes defective expansion of ectodermal progenitor cells and impaired FGF signalling in AEC syndrome
Abstract
Ankyloblepharon-ectodermal defects-cleft lip/palate (AEC) syndrome, which is characterized by cleft palate and severe defects of the skin, is an autosomal dominant disorder caused by mutations in the gene encoding transcription factor p63. Here, we report the generation of a knock-in mouse model for AEC syndrome (p63(+/L514F) ) that recapitulates the human disorder. The AEC mutation exerts a selective dominant-negative function on wild-type p63 by affecting progenitor cell expansion during ectodermal development leading to a defective epidermal stem cell compartment. These phenotypes are associated with impairment of fibroblast growth factor (FGF) signalling resulting from reduced expression of Fgfr2 and Fgfr3, direct p63 target genes. In parallel, a defective stem cell compartment is observed in humans affected by AEC syndrome and in Fgfr2b(-/-) mice. Restoring Fgfr2b expression in p63(+/L514F) epithelial cells by treatment with FGF7 reactivates downstream mitogen-activated protein kinase signalling and cell proliferation. These findings establish a functional link between FGF signalling and p63 in the expansion of epithelial progenitor cells and provide mechanistic insights into the pathogenesis of AEC syndrome.
Copyright © 2012 EMBO Molecular Medicine.
Figures
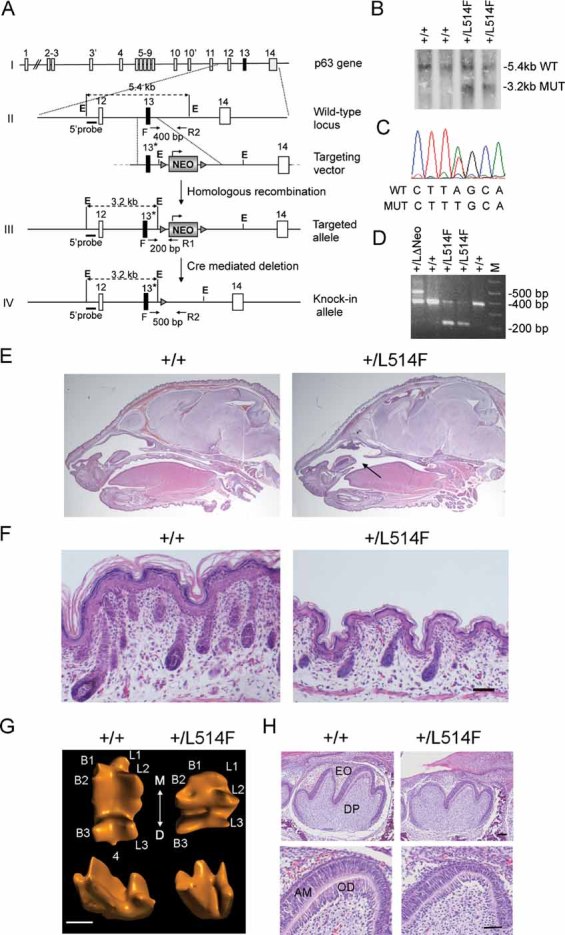
Gene targeting strategy used to generate the p63+/L514F knock-in mice. The L514F mutation is indicated with *. Dotted black lines indicate the sizes of the fragments generated from each allele upon EcoRI (E) digestion. Oligonucleotide primers (arrows) used for PCR analysis and the relative PCR product length, are indicated.
Southern blot analysis of ES cell clones using the EcoRI digestion of genomic DNA and the 5′ probe upstream of the recombinant targeted site.
DNA sequencing analysis of the L514F point mutation in properly targeted ES cells.
In vivo removal of the NEO cassette obtained by crossing chimeras with CMV-Cre transgenic mice, as revealed by PCR analysis performed on tail genomic DNA using one forward (F) and two reverse primers (R1 and R2).
H&E staining of sagittal sections of +/+ and p63+/L514F newborn heads. Cleft of the secondary palate is indicated by the arrow.
H&E staining of dorsal skin of p63+/L514F mice at P0. Mutant epidermis is thinner and with less developed hair follicles.
Three-dimensional computer-aided reconstruction of tooth crown morphology of the first lower molar at P0. The cusps are numbered as buccal (B1, 2, 3), lingual (L1, 2, 3) and distal (4). The axis of the tooth coming in contact with adjacent teeth is indicated: mesial (M) and distal (D). Scale bar: 400 µm.
Histological analysis of sagittal sections of the first lower molar at P0. EO, enamel organ; DP, dental papilla; AM, ameloblasts; OD, odontoblasts. Scale bar: upper panel 50 µm, lower panel 40 µm.
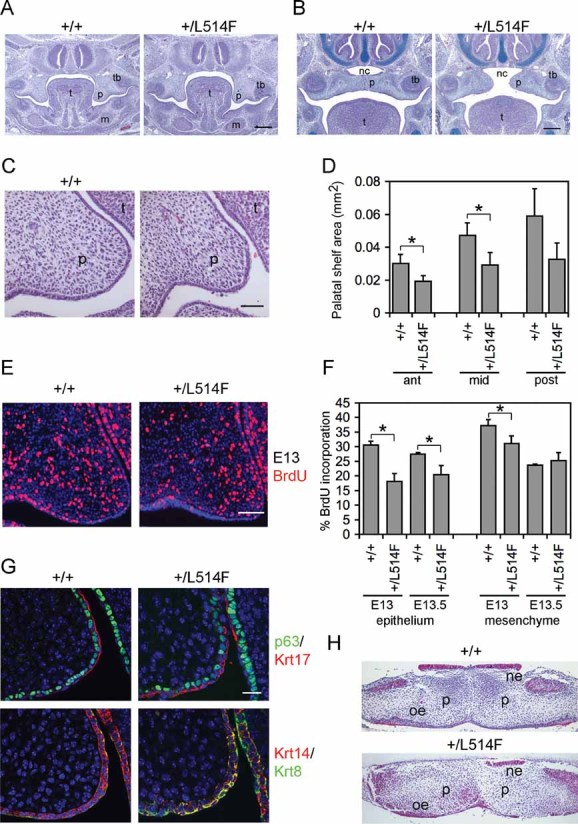
H&E staining of coronal sections of p63+/L514F mid palate at E13.5 reveals grossly similar morphology of palatal shelves compared to controls. t, tongue; p, palatal shelf; tb, molar tooth bud; m, mandible. Scale bar: 200 µm.
H&E and Alcian Blue staining of coronal sections of p63+/L514F mid palate at E14.5 reveals a failure of the palatal shelves to meet in the horizontal plane. nc, nasal cavity. Scale bar: 200 µm.
A closer view of H&E staining of E13.5 coronal sections reveals that mutant palatal shelves are hypoplastic compared to controls. Scale bar: 50 µm.
Quantification of the anterior, mid and posterior palatal shelf area. Error bars represent standard deviation (SD). Anterior palate *p-value = 0.00032; n = 9. Mid palate *p-value = 0.00079; n = 9. Posterior palate p-value = 0.0097; n = 9.
Immunofluorescence with anti-BrdU antibodies at E13 (left panel) reveals reduced proliferation of mutant palatal shelves.
The average percentage of BrdU incorporation is reduced in mutant palatal epithelium at E13 and E13.5. Epithelium at E13 p-value = 0.009; n = 9. Mesenchyme at E13 p-value = 0.032; n = 9. Epithelium at E13.5 p-value = 0.018; n = 9. Data are represented as mean ± SD. Scale bar: 50 µm.
Double immunofluorescence staining for the indicated markers reveals hypoplasia and disorganization of the palatal shelf epithelium at E13.5. Scale bar: 20 µm.
Palatal explant culture assay reveals that mutant palatal shelves fuse appropriately. Palatal shelves freshly isolated at E13.5 were placed in contact and cultured for 48 h. ne, nasal epithelium; oe, oral epithelium.
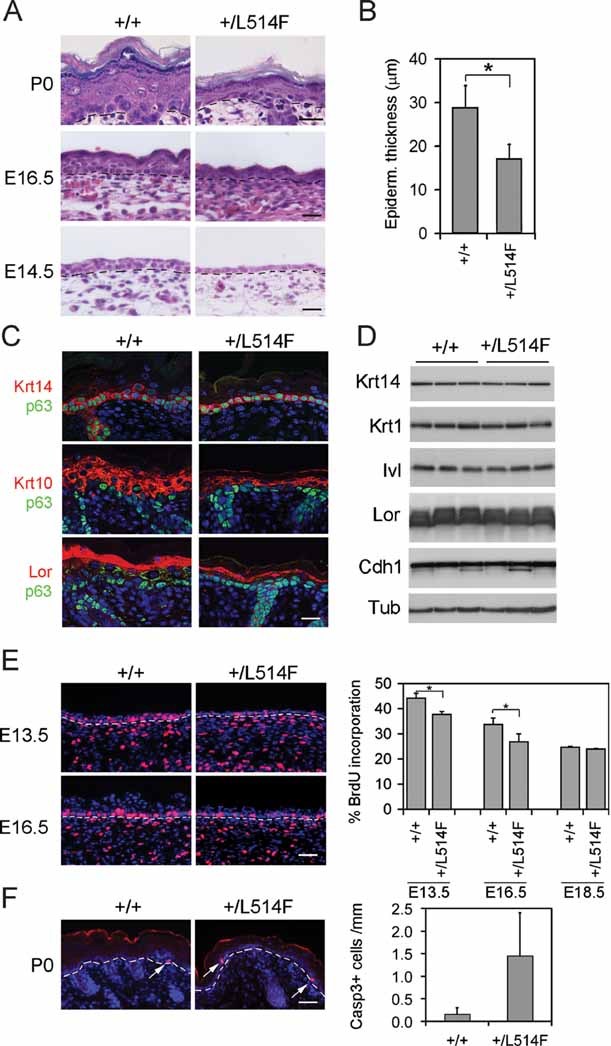
H&E staining reveals hypoplasia of p63+/L514F epidermis at the indicated times of development. Dashed lines indicate the border between epidermis (top) and dermis (bottom). Scale bar: 50 µm.
Quantification of epidermal thickness (µm) in +/+ and p63+/L514F skin at birth (*p-value = 0.0009; n = 6). Data are represented as mean ± SD.
Immunofluorescence analysis for p63, Krt14 (basal layer), Krt10 (spinous layer), and loricrin (Lor, granular layer) at P0 reveals appropriate expression of these differentiation markers in mutant epidermis. Scale bar: 20 µm.
Immunoblotting of total cell extracts from neonatal epidermis using antibodies against the indicated differentiation markers, Krt1 (spinous layer), the upper spinous layer marker involucrin (Ivl), the adherens junction component E-cadherin (Cdh1) and αTubulin (Tub) as loading control.
BrdU staining of the epidermis reveals reduced proliferation in mutant epidermis during development. Left panels: BrdU positive cells are in red; nuclei are stained with DAPI. Dashed lines indicate the border between epidermis (top) and dermis (bottom). Scale bar: 50 µm. Right panel: BrdU positive cells are expressed as percentage of the total number of basal cells (E13.5 *p-value = 0.0151; n = 7. E16.5 *p-value = 0.0271; n = 7). Data are represented as mean ± SD.
Left panel: immunofluorescence for active caspase 3 at P0 showing low levels of apoptosis in p63+/L514F epidermis compared to wild-type. Arrows indicate apoptotic cells. Scale bar: 70 µm. Right panel: quantification of active caspase 3 positive cells. Data are represented as mean ± SD (p-value = 0.0010; n = 16).

Real-time RT-PCR performed on total mRNA isolated from palatal shelves at E13.5, embryonic skin at E14.5, and from neonatal keratinocytes, reveals reduced expression of Fgfr2b in p63+/L514F tissues compared to +/+ controls. Data are normalized for β-actin mRNA levels and are represented as mean ± SD normalized mRNA levels (palate p-value = 0.0015; n = 9, skin p-value = 0.00044; n = 8; keratinocytes p-value = 0.0098; n = 7) and Fgfr3b (palate p-value = 0.0112; n = 8; skin p-value = 0.0092; n = 8; keratinocytes p-value = 0.0002; n = 6).
Immunostaining for Fgfr2 (red) reveals its reduced expression in mutant embryonic skin at E15.5 compared to control. Nuclei are stained in blue. Scale bar: 20 µm.
Real-time RT-PCR for Fgfr2 pre-mRNA reveals reduced expression of the primary transcript in p63+/L514F keratinocytes compared to +/+ controls. Data are represented as mean ± SD (p-value = 0.023; n = 3). To control for genomic DNA contamination, reverse transcriptase (RT) was not added in the indicated samples.
ChIP assay of mouse keratinocyte chromatin using mouse p63 polyclonal antibodies and rabbit IgG as negative control reveals strong p63 binding to Fgfr2 (+1.8 kb from TSS) and Fgfr3 (−10 kb from TSS) regulatory regions. The result is representative of three independent experiments, and error bars represent standard error (SE).
ChIP assay of E14.5 skin chromatin reveals a similar p63 binding to Fgfr2 and Fgfr3 regulatory regions. The control regions (ctr) were at −130 bp from TSS and −8.5 kb from TSS in Fgfr2 and Fgfr3, respectively. Data are represented as mean ± SE and are representative of at least three independent experiments.
Luciferase assay of the Fgfr2 regulatory region in H1299 reveals that p63 can enhance the wild-type (WT) region activity but not the mutant (MUT) one in cells devoid of p63. See Supporting Information Table S3 for the p63 binding site mutation.
Luciferase assay in H1299 reveals that mutant p63L514F is unable to transactivate the Fgfr2 regulatory region and interferes with wild-type p63 affecting its transactivation ability. Data are represented as mean ± SE and are representative of at least three independent experiments.
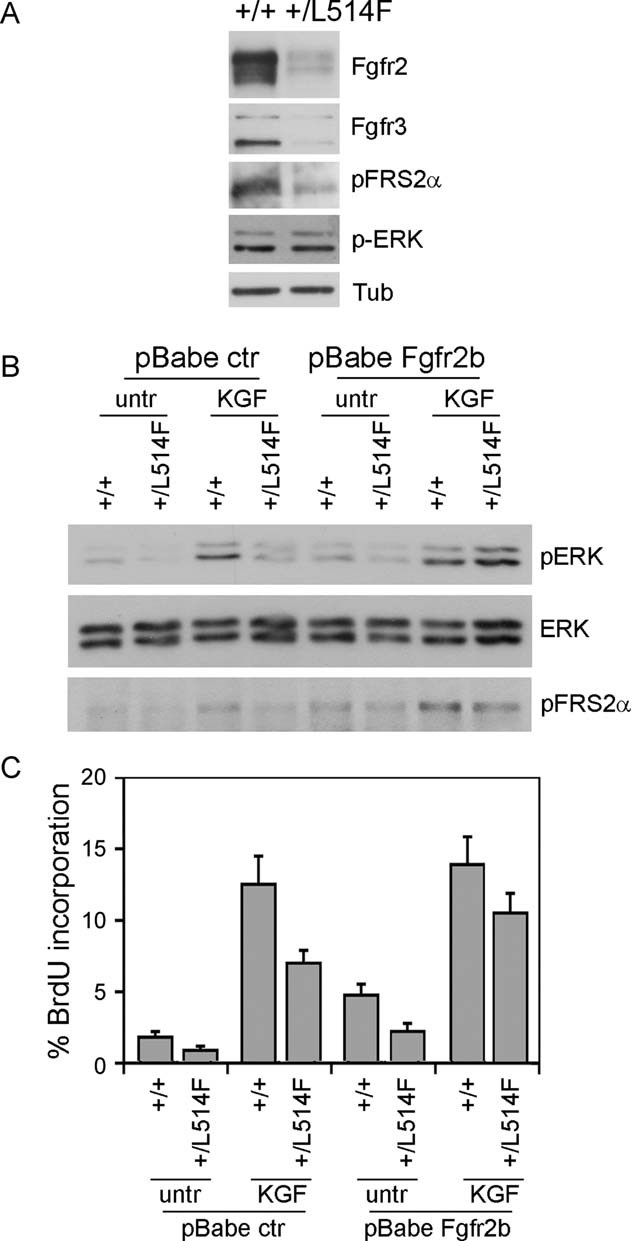
Immunoblotting analysis for Fgfr2, Fgfr3 and the phosphorylated active form of the downstream signalling proteins FRS2α (p-FRS2α) and ERK (p-ERK) reveals downregulation of the FGF receptor and downstream signalling in p63+/L514F keratinocytes compared to controls. Tubulin was used to normalize samples for protein content.
Immunoblotting analysis for ERK phosphorylation reveals reduced ERK activation in p63+/L514F starved keratinocytes compared to controls upon KGF treatment. Exogenous expression of Fgfr2b and concomitant treatment with KGF can restore ERK phosphorylation. Total ERK protein levels were used as control. pFRS2α was used as control of FGFR activation.
BrdU incorporation of starved keratinocytes treated as in (B) reveals that p63+/L514F cells have a defective cell proliferation in the absence of exogenous growth factors. Rescue is obtained by exogenous expression of Fgfr2b and concomitant treatment with KGF (25% difference between mock-infected untreated samples and KGF treated/Fgfr2b expressing cells; p-value = 0.005, n = 6 of three independent experiment). Data are represented as mean ± SD.
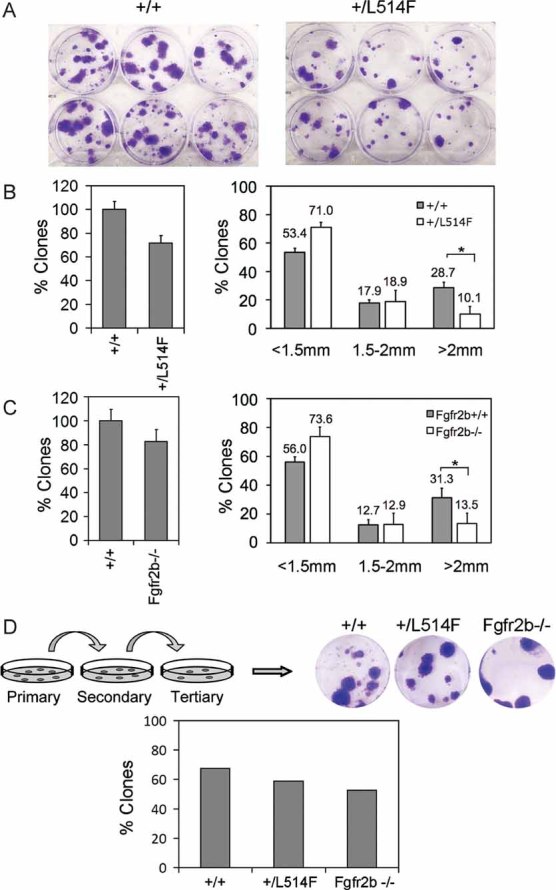
Clonogenicity assay performed with freshly isolated epidermal cells cultured for 3 weeks reveals a reduced clonogenic potential of p63+/L514F keratinocytes.
Left panel: Percentage of total number of p63+/L514F compared to +/+ clones. The difference is not statistically significant. Right panel: A reduction in clones larger than 2 mm is observed in p63+/L514F mice compared to +/+. Data are represented as mean ± SD (*p-value = 0.0076; n = 6).
Clonogenicity assay performed with freshly isolated Fgfr2b−/− and +/+ keratinocytes cultured for 3 weeks. Clonogenicity assay reveals a reduction in the number of clones with a high-clonogenic potential (>2 mm) in Fgfr2b−/− mice compared to wild-type. Data are represented as mean ± SD (*p-value = 0.035; n = 6).
Secondary and tertiary replating of clones reveals that p63+/L514F epidermal cells can self-renew similarly to +/+ in tertiary cultures. The percentage of secondary clones that formed tertiary clones is indicated (+/+ n = 37; p63+/L514F = 27; Fgfr2−/− n = 19).

Immunostaining reveals reduced Krt15 expression (green) in the epidermis and in the hair follicle of p63+/L514F and Fgfr2b−/− compared to +/+ control. Nuclei are stained with DAPI. Scale bar: 50 µm.
Immunoblotting for Krt15 confirms decreased protein expression in p63+/L514F epidermis compared to +/+. Tubulin was used to normalize samples.
Immunostaining for Krt15 (green) of skin biopsies from AEC patients (AEC1 and AEC2) and a human unaffected control (CTR) demonstrates reduced Krt15 expression in AEC skin. Scale bar: 50 µm.
Real-time RT-PCR for Krt15 mRNA in human skin isolated from AEC patients or controls (CTR) reveals a quantitative reduction of Krt15 mRNA levels in the skin of AEC patients compared to wild-type. Data are represented as mean ± SD (p-value = 0.026).
Immunofluorescence for Sox9 on neonatal mouse skin reveals reduced Sox9 expression in p63+/L514F and Fgfr2b−/− compared to +/+ control. Scale bar: 50 µm.
Levels of Sox9 mRNA in human skin isolated from AEC patients or controls (CTR) were assessed by real-time RT-PCR. Data are represented as mean ± SD (p-value = 3.85 × 10⁻⁵).
Comment in
-
p63 and FGFR: when development meets proliferation.EMBO Mol Med. 2012 Mar;4(3):165-7. doi: 10.1002/emmm.201200202. Epub 2012 Feb 13. EMBO Mol Med. 2012. PMID: 22331572 Free PMC article. No abstract available.
References
-
- Antonini D, Russo MT, De Rosa L, Gorrese M, Del Vecchio L, Missero C. Transcriptional repression of miR-34 family contributes to p63-mediated cell cycle progression in epidermal cells. J Invest Dermatol. 2010;130:1249–1257. - PubMed
-
- Bell O, Tiwari VK, Thoma NH, Schubeler D. Determinants and dynamics of genome accessibility. Nat Rev Genet. 2011;12:554–564. - PubMed
-
- Browne G, Cipollone R, Lena AM, Serra V, Zhou H, van Bokhoven H, Dotsch V, Merico D, Mantovani R, Terrinoni A, et al. Differential altered stability and transcriptional activity of DeltaNp63 mutants in distinct ectodermal dysplasias. J Cell Sci. 2011;124:2200–2207. - PubMed
-
- Carroll DK, Carroll JS, Leong CO, Cheng F, Brown M, Mills AA, Brugge JS, Ellisen LW. p63 regulates an adhesion programme and cell survival in epithelial cells. Nat Cell Biol. 2006;8:551–561. - PubMed
Publication types
MeSH terms
Substances
Supplementary concepts
Grants and funding
LinkOut - more resources
Full Text Sources
Medical
Miscellaneous
