. 2012 Jan;24(1):50-65.
doi: 10.1105/tpc.111.092411. Epub 2012 Jan 13.

Acetylesterase-mediated deacetylation of pectin impairs cell elongation, pollen germination, and plant reproduction

Affiliations

Acetylesterase-mediated deacetylation of pectin impairs cell elongation, pollen germination, and plant reproduction

Jin-Ying Gou et al. Plant Cell. 2012 Jan.

Abstract

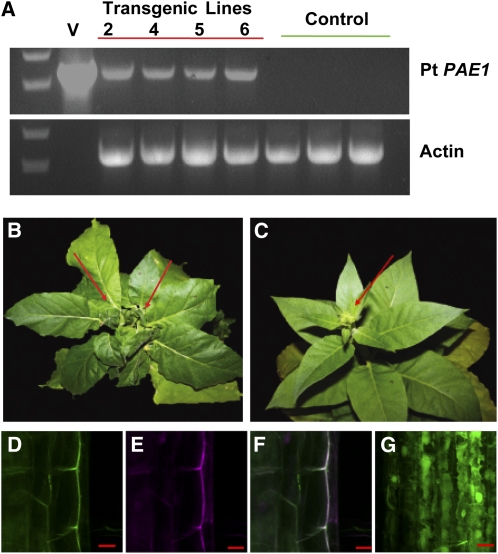
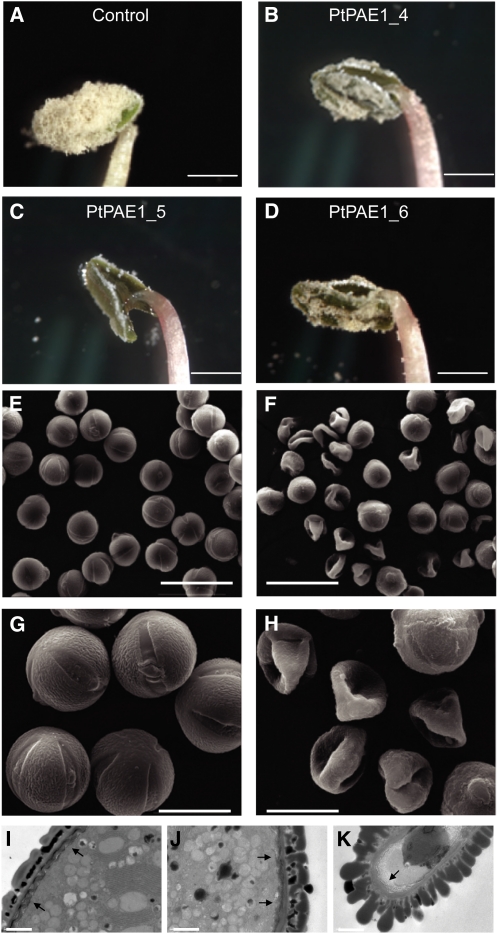
Pectin is a major component of the primary cell wall of higher plants. Some galacturonyl residues in the backbone of pectinaceous polysaccharides are often O-acetylated at the C-2 or C-3 position, and the resulting acetylesters change dynamically during the growth and development of plants. The processes involve both enzymatic acetylation and deacetylation. Through genomic sequence analysis, we identified a pectin acetylesterase (PAE1) from black cottonwood (Populus trichocarpa). Recombinant Pt PAE1 exhibited preferential activity in releasing the acetate moiety from sugar beet (Beta vulgaris) and potato (Solanum tuberosum) pectin in vitro. Overexpressing Pt PAE1 in tobacco (Nicotiana tabacum) decreased the level of acetyl esters of pectin but not of xylan. Deacetylation engendered differential changes in the composition and/or structure of cell wall polysaccharides that subsequently impaired the cellular elongation of floral styles and filaments, the germination of pollen grains, and the growth of pollen tubes. Consequently, plants overexpressing PAE1 exhibited severe male sterility. Furthermore, in contrast to the conventional view, PAE1-mediated deacetylation substantially lowered the digestibility of pectin. Our data suggest that pectin acetylesterase functions as an important structural regulator in planta by modulating the precise status of pectin acetylation to affect the remodeling and physiochemical properties of the cell wall's polysaccharides, thereby affecting cell extensibility.


Figures

Figure 1.
Figure 1.
Phylogenetic Analysis of Polysaccharide Acetylesterases. The neighbor-joining tree was constructed from the aligned full-length amino acid sequences of putative carbohydrate acetylesterases from P. trichocarpa and Arabidopsis. The amino acid sequences of the following enzymes were also included: CAA67728 (Vr PAE, from V. radiata), AJ507215 (PaeX, from Erwinia chrysantemi), Y09828 (PaeY, from E. chrysantemi), BAA11692 (YxiM, from Bacillus subtilis), and CAA61858 (RAGA1, from A. aculeatus). Bar represents the output distance as number of substitutions per site (i.e., 0.2 substitutions per site).
Figure 2.
Figure 2.
Enzymatic Activity of Recombinant Pt PAE1. (A) Acetylesterase activity of recombinant PAE1 with different natural carbohydrate polymers. (B) Methylesters released by 2 μg pectin esterase (as positive control), Pt PAE1, and buffer (as negative control [Neg. Ctrl.]) within 15 min at 35°C. (C) Ferulic acid released by alkaline treatment (2 n NaOH as positive control), 2 μg Pt PAE1, or buffer as negative control in 15 min at 35°C. Data represent mean of triplicate samples. The error bar represents se.
Figure 3.
Figure 3.
Overexpression of Pt PAE1 in Tobacco. (A) RT-PCR examination of Pt PAE1 expression in transgenic tobacco lines. Full-length PAE1 cDNA was detected in the transgenic lines but not in the controls. V, transgenic vector (as positive control). The data represent the result from one of three replicates. (B) and (C) Vegetative development of transgenic (B) and control (C) tobacco. Note that a couple of primary shoot apexes were apparent in the transgenic line, Pt PAE1_6 (arrows in [B]) but that only one was present in the control plant (arrow in [C]). (D) to (F) Subcellular localization of Pt PAE1. (D) Green fluorescence signal of GFP-PAE1 fusion monitored in the cells of 5-d-old dark-grown transgenic seedling. (E) The cells stained with propidium iodide. (F) The merged image of (D) and (E). (G) Green fluorescence signal of the free GFP. Bars = 2 μm.
Figure 4.
Figure 4.
Cell Wall Acetylester Content of Pt PAE1 Overexpression Plants. (A) and (B) Acetylester content of the water- and acid-soluble pectins from young leaves of the transgenic and control lines. (C) Acetylester content of xylan from xylem cell walls. Data represent mean of triplicate samples. Error bar represents sd. Asterisks indicate a statistically significant change (P < 0.05) under Student’s t test.
Figure 5.
Figure 5.
Development of Floral Tissues in Tobacco Plants Overexpressing Pt PAE1. (A) Style and filaments in the developing flowers (at stage 12) of the control and transgenic (Pt PAE1) plants. (B) The lengths of epidermal cells of the style and filament at the apical, middle, and basal parts of both tissues of independent transgenic lines. Data represent the average of 40 cells. Error bar denotes the sd. Asterisks indicate a statistically significant change (P < 0.05) under Student’s t test. (C) to (F) Positioning of stigma and anthers in the flower of the wild-type control ([C] and [D]) and in the overexpression plants ([E] and [F]) at flowering stages 11 ([C] and [E]) and 12 ([D] and [F]). Bar = 5 mm. [See online article for color version of this figure.]
Figure 6.
Figure 6.
Cell Wall Esters of the Style and Filament. (A) to (H) Optical and FTIR images of the basal tissues of the style and middle portion of the filament. The false-color images represent the ratio of ester to polysaccharide in the style (A) and filament (E) of control plants and the Pt PAE1 overexpression ([C] and [G]) plants. The corresponding optical images of the tissues are shown in (B), (D), (F), and (H). (I) The representative FTIR spectra of the style, filament, and their corresponding control tissues. Each averaged spectrum was normalized with the area under the polysaccharide peaks so that the sizes of the ester peaks (at 1740 cm−1, arrow) were easily compared. Tg, transgenic. (J) Content of pectin acetyl ester in the style and filament. Asterisks indicate a statistically significant change (P < 0.05) under Student's t test. Data represent mean of triplicate experiments. Error bar represents se.
Figure 7.
Figure 7.
Overexpression of Pt PAE1 Affects Pollen Grain Development in Tobacco. (A) to (D) Mature pollen grains in the pollen sacs of the control (A) and transgenic ([B] to [D]) plants at flowering stage 12. (E) to (H) Scanning electron microscopic images of the pollen grains of the control ([E] and [G]) and transgenic ([F] and [H]) plants. (I) to (K) Transmission electron microscope images of the control (I), transgenic normal (J), and transgenic collapsed (K) pollen grains. Arrows point to the changes of the intine layer and the putative cellulose microfibrils. Bars = 2.5 mm in (A) to (D) 50 μm in (E) and (F), 20 μm in (G) and (H), and 1 μm in (I) to (K). [See online article for color version of this figure.]
Figure 8.
Figure 8.
Chemical Composition of Mature Pollen Grains. (A) Average FTIR spectra of pollen grains from the transgenic (dotted lines) and control (solid line) plants. Each spectrum represents the average of 20 samples. The arrow indicates the peak of the acylester group. (B) Acetic acid content of pollen grains isolated from transgenic and control plants. Asterisks indicate statistically significant changes under Student's t test (P < 0.01). Data represent the mean of triplicate samples. Error bar represents se.
Figure 9.
Figure 9.
Pollen Grain Germination and Pollen Tube Elongation. (A) and (B) Germination of mature pollen from Pt PAE1 overexpression (A) and control (B) plants in solid germination medium. (C) and (D) Pollen germination and tube growth of Pt PAE1 overexpression (C) and the control (D) plants in the transmitting tract of the wild-type style. (E) to (H) In vitro pollen germination and pollen tube growth when wild-type pollen was treated with exogenous Pt PAE1 recombinant protein ([E] and [G]) or with BSA as the control ([F] and [H]). Bars= 20 μm in (A) to (D) and 50 μm in (E) to (H).
Figure 10.
Figure 10.
Development of the Seeds and Capsules of Pt PAE1 Transgenic Plants. (A) to (D) Developing seeds in the capsules of the transgenic (A) and control (B) tobacco plants at 14 d postanthesis (the walls of capsules were peeled off for clearance) and the mature capsules of the transgenic (C) and the control (D) plants. Bar = 0.5 cm. (E) Average weight of capsules and produced seeds (per capsule) of transgenic (Pt PAE1_2, 4, 5, and 6) and four independent control ([A] to [D]) plants. Data represent the mean of 10 capsules from each line. Error bar represents the sd. Asterisks indicate significant difference under pairwise comparison to the control line (A); P < 0.01, Student's t test. [See online article for color version of this figure.]
Figure 11.
Figure 11.
Effects of Pt PAE1 Overexpression on Pectin Digestibility. (A) The digestion of leaf acid-soluble pectin from control (solid line) or transgenic (dotted lines) plants by pectinase. (B) Quantification of monomeric and oligomeric sugars released in the reactions of (A). (C) Pectinase digestion of sugar beet pectin with (dotted line) or without (solid line) recombinant PAE1 pretreatment. (D) Quantification of the released monomeric and oligomeric sugars and acetic acid/citric acid in the reactions of (C). Data represent the mean of triplicate samples. Error bar represents sd. A/C, acetic acid and citric acid overlapping peak; C, citric acid; M, galacturonic acid; O, oligomeric sugar. *P < 0.05, Student’s t test; **P < 0.01, Student's t test.

References

    1. André-Leroux G., Tessier D., Bonnin E. (2009). Endopolygalacturonases reveal molecular features for processivity pattern and tolerance towards acetylated pectin. Biochim. Biophys. Acta 1794: 5–13 - PubMed
    1. Benen J.A.E., Kester H.C.M., Visser J. (1999). Kinetic characterization of Aspergillus niger N400 endopolygalacturonases I, II and C. Eur. J. Biochem. 259: 577–585 - PubMed
    1. Biely P., MacKenzie C.R., Puls J., Schneider H. (1986). Cooperativity of esterases and xylanases in the enzymatic degradation of acetyl xylan. Biotechnol. 4: 731–733
    1. Bonnin E., Clavurier K., Daniel S., Kauppinen S., Mikkelsen J.D.M., Thibault J.F. (2008). Pectin acetylesterases from Aspergillus are able to deacetyalte homogalacturonan as well as rhamnogalacturonan. Carbohydr. Polym. 74: 411–418
    1. Bonnin E., Le Goff A., van Alebeek G.J.W.M., Voragen A.G.J., Thibault J.F. (2003). Mode of action of Fusarium moniliforme endopolygalacturonase towards acetylated pectin. Carbohydr. Polym. 52: 381–388

Publication types

Associated data

LinkOut - more resources