. 2012 Mar;32(3):623-32.
doi: 10.1161/ATVBAHA.111.242180. Epub 2012 Jan 12.

Dynamic immune cell accumulation during flow-induced atherogenesis in mouse carotid artery: an expanded flow cytometry method

Affiliations

Dynamic immune cell accumulation during flow-induced atherogenesis in mouse carotid artery: an expanded flow cytometry method

Noah Alberts-Grill et al. Arterioscler Thromb Vasc Biol. 2012 Mar.

Abstract

Objective: Inflammation plays a central role in atherosclerosis. However, the detailed changes in the composition and quantity of leukocytes in the arterial wall during atherogenesis are not fully understood in part because of the lack of suitable methods and animal models.

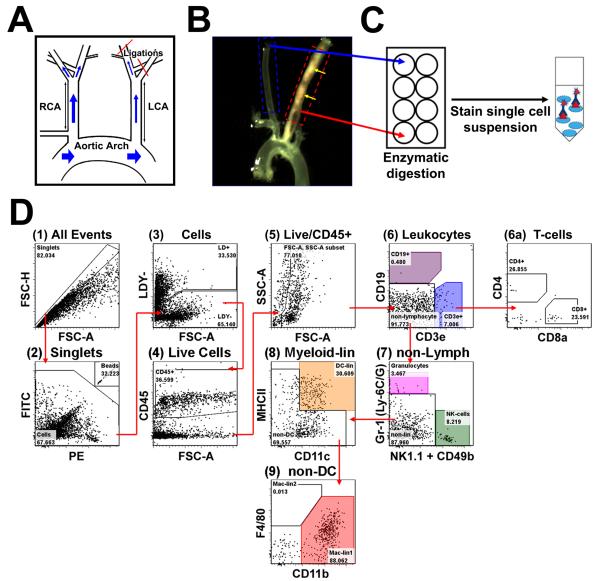
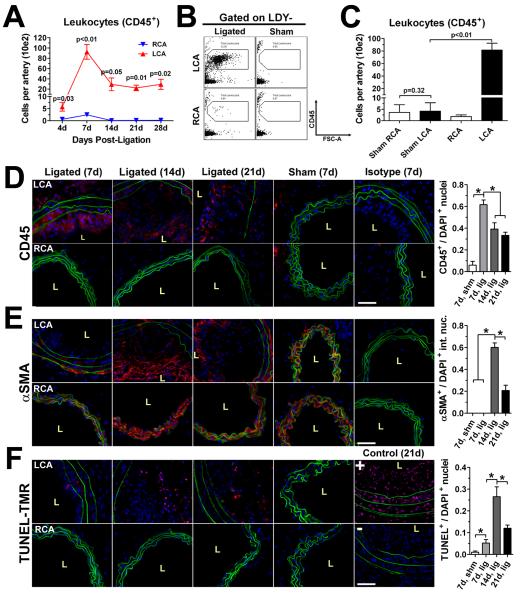
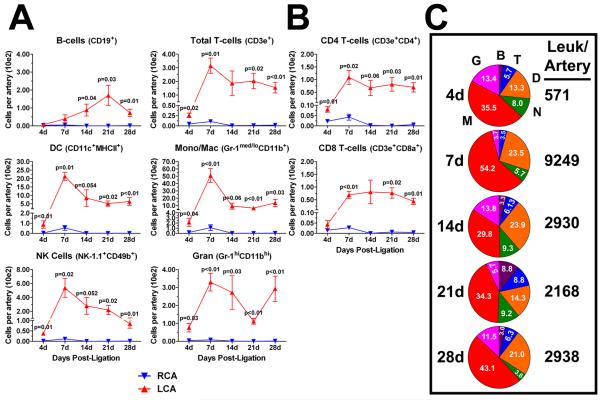
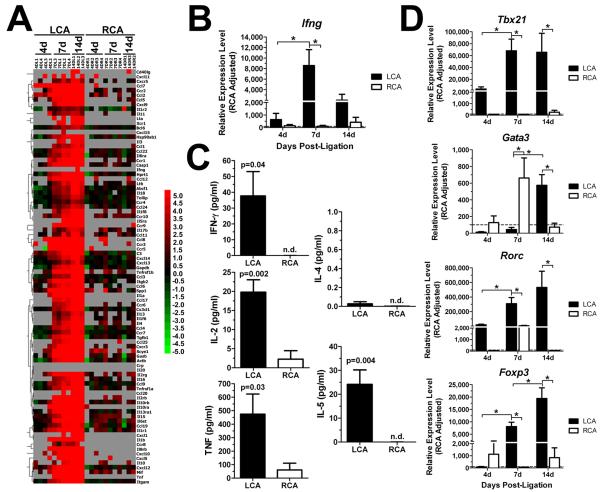
Methods and results: We developed a 10-fluorochrome, 13-parameter flow cytometry method to quantitate 7 major leukocyte subsets in a single digested arterial wall sample. Apolipoprotein E-deficient mice underwent left carotid artery (LCA) partial ligation and were fed a high-fat diet for 4 to 28 days. Monocyte/macrophages, dendritic cells, granulocytes, natural killer cells, and CD4 T cells significantly infiltrated the LCA as early as 4 days. Monocyte/macrophages and dendritic cells decreased between 7 and 14 days, whereas T-cell numbers remained steady. Leukocyte numbers peaked at 7 days, preceding atheroma formation at 14 days. B cells entered LCA by 14 days. Control right carotid and sham-ligated LCAs showed no significant infiltrates. Polymerase chain reaction and ELISA arrays showed that expression of proinflammatory cytokines and chemokines peaked at 7 and 14 days postligation, respectively.

Conclusion: This is the first quantitative description of leukocyte number and composition over the life span of murine atherosclerosis. These results show that disturbed flow induces rapid and dynamic leukocyte accumulation in the arterial wall during the initiation and progression of atherosclerosis.


Figures

Figure 1
Figure 1. Development of a thirteen-parameter immunophenotyping study of leukocytes in the murine carotid artery
A, Disturbed flow was induced in the LCA of ApoE−/− mice by partial ligation surgery, while the contralateral RCA was used as an internal control. B, Ligated mice were fed a HFD for 4 to 28 days. Shown is a representative micrograph displaying diffuse atherosclerosis (yellow arrows) in LCA, but not in RCA, two weeks post-ligation. C, LCAs (dashed red box) and RCAs (dashed blue box in (B) obtained from 3 mice at a given time point were pooled (regarded as n=1) and vascular leukocytes extracted. D, Shows the gating strategy used for flow cytometry analyses for a representative arterial leukocyte sample harvested from LCA 7 days post-ligation. Ultra-bright counting beads (D2) were used to calculate absolute cell counts. Gate numbers indicate percent of parent. FSC-H, forward scatter height; FSC-A, forward scatter area; SSC-A, side scatter area.
Figure 2
Figure 2. Dynamic infiltration of leukocytes into LCA in response to disturbed flow
A, Leukocyte (CD45+) accumulation in mouse carotids was examined by the thirteen-parameter immunophenotyping analysis using LCA or RCA over a 4 week time course following ligation and HFD. Graph depicts number of cells (in hundreds) per carotid artery (n=4 to 5 pools of 3 arteries each). B-C, Leukocyte counts in LCA and RCA were compared by our flow cytometry method, using ligated and sham-operated mice (n=3 pools of 3 arteries each) at 7 days post-ligation. Shown are representative dot plots (B) and leukocyte numbers (C). D-F, Flow cytometry data were confirmed by immunofluorescence staining for CD45 (D), αSMA (E), or TUNEL stain (F) (red) in LCA and RCA frozen cross-sections obtained 7 (n=7), 14 (n=6), or 21 (n=7) days post-ligation along with 7 day sham-ligated controls (n=3), and isotype control stains. Elastic laminae autofluorescence (green) and nuclear staining by DAPI (blue) are shown. Quantitations of CD45+, intimal αSMA+, and TUNEL+ staining nuclei residing in the arterial wall are shown to the right of their respective micrographs (D-F). Data are mean values ±SEM. p values in (A) denote comparisons of LCA versus RCA; in (D-F), magnification x40; scale bars, 50 μm; L, lumen; *, p<0.05.
Figure 3
Figure 3. Disturbed flow induces a transient peak accumulation of innate cells, sustained T-cell accumulation, and delayed B-cell entry into LCA
The flow cytometry data shown in Figure 2a was further analyzed to quantitate dynamic changes in specific immune cell lineages. A, Leukocytes (CD45+) were subdivided into six major immune cell types (B- and T-cells, DCs, monocyte/macrophage, NK cells and granulocytes) over a four week time course in LCA and RCA. B, T-cells were further subdivided into CD4 and CD8 T-cells. Shown (A-B) are absolute cell numbers (in hundreds) per carotid artery (n=4 to 5 pools of 3 arteries each). C, Pie charts show compositional analyses of vascular leukocytes in the flow-disturbed LCA, presented in (A). Each pie slice denotes mean percentage of total leukocytes (white numbers). Numbers to the right of the pie charts denote mean leukocyte numbers per carotid artery. Data are mean values ±SEM. B, B-cells; T, T-cells; D, DCs; N, NK-cells; M, macrophages; G, granulocytes.
Figure 4
Figure 4. Disturbed flow induces accumulation of macrophages, dendritic cells (DC) and T-cells in LCA
A-B, Frozen sections from LCA and RCA obtained 7 (A) or 21 days (B) post-ligation were stained red with CD68, CD11b, CD11c, CD3, or isotype controls (C). Shown are representative images of n=7 (7d images) or n=5-7 (21d images). Elastic laminae autofluorescence (green) and nuclear staining by DAPI (blue) are shown. Magnification x40 (E); scale bars, 50 μm; L, lumen.
Figure 5
Figure 5. Dynamic changes in expression of cytokines and chemokines in LCA by disturbed flow
A-B, D, Total RNAs obtained from LCA and RCA were analyzed by PCR cytokine arrays (A) or by qPCR (B and D). The heat map shown in (A) displays relative expression levels of cytokines and cytokine receptors in LCA compared to RCA. Green indicates downregulation, black indicates no change, and red indicates upregulation. Grey boxes indicate undetectable copy number (>35 cycles). Additional qPCR was carried out using the total RNAs to determine expression of Ifng (B) and Tbx21, Gata3, Rorc, Foxp3 (D). Shown are data for n=4 (4 and 7 day) and n=3 (14 day). C, Production of IFNγ, IL-2, TNFα, IL-4, and IL-5 proteins was determined by ELISA using 7 day post-ligation LCA and RCA stimulated ex vivo with TPA and ionomycin for 16 hr (n=5). Data are mean ±SEM. *, p<0.05. n.d., not detected.

References

    1. Hansson GK. Inflammation, atherosclerosis, and coronary artery disease. N Engl J Med. 2005;352:1685–1695. - PubMed
    1. Libby P. Inflammation in atherosclerosis. Nature. 2002;420:868–874. - PubMed
    1. Galkina E, Ley K. Immune and inflammatory mechanisms of atherosclerosis (*) Annu Rev Immunol. 2009;27:165–197. - PMC - PubMed
    1. Hansson GK, Hermansson A. The immune system in atherosclerosis. Nat Immunol. 2011;12:204–212. - PubMed
    1. Hansson GK, Robertson AK, Soderberg-Naucler C. Inflammation and atherosclerosis. Annu Rev Pathol. 2006;1:297–329. - PubMed

Publication types

MeSH terms