

Trehalose 6-phosphate is required for the onset of leaf senescence associated with high carbon availability
- PMID: 22247267
- PMCID: PMC3291265
- DOI: 10.1104/pp.111.191908
Trehalose 6-phosphate is required for the onset of leaf senescence associated with high carbon availability
Abstract
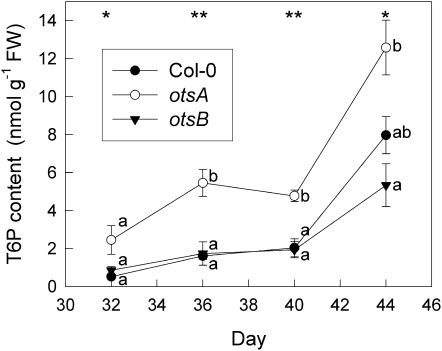
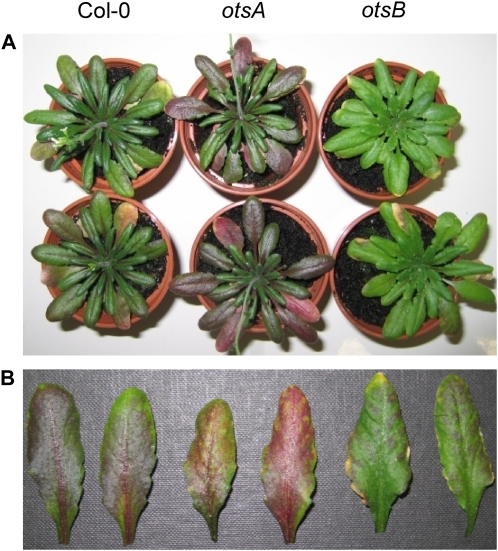
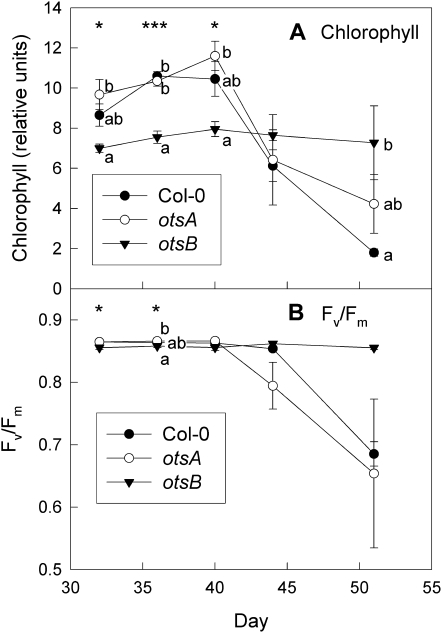
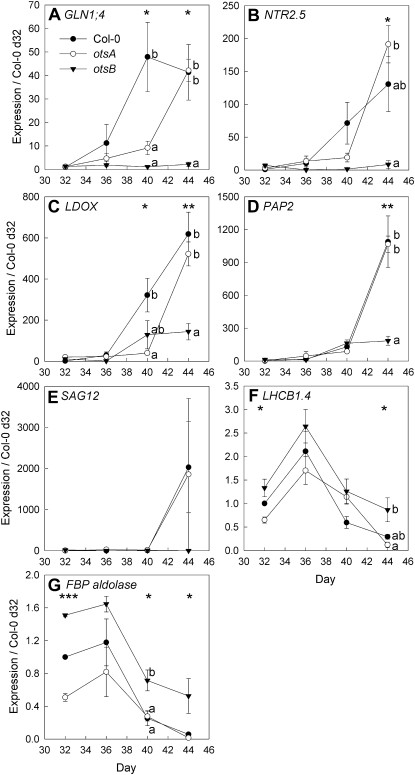
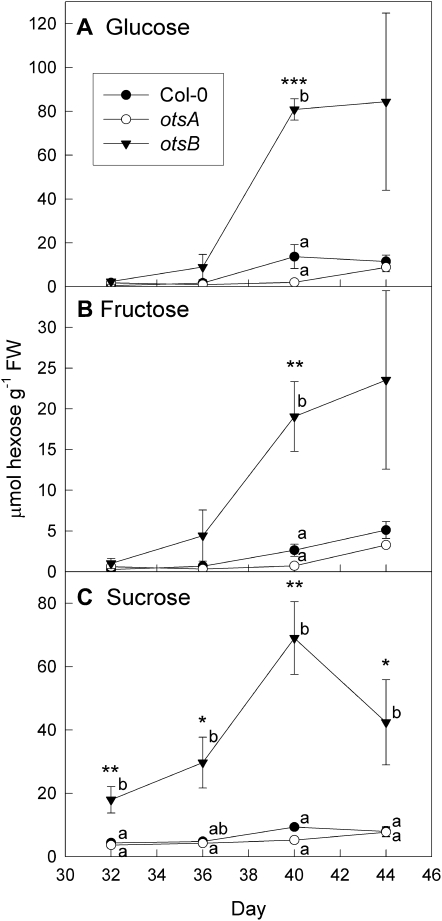
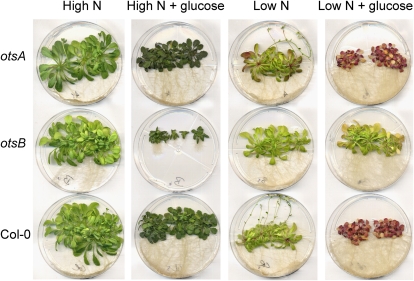
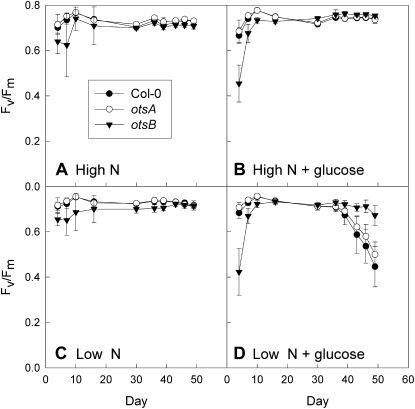
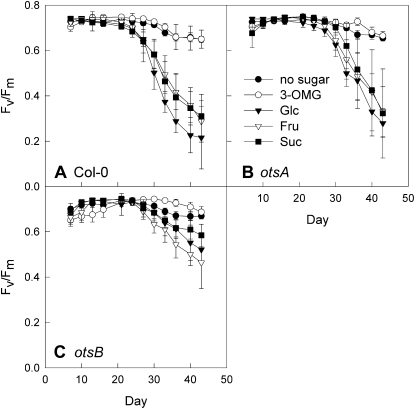
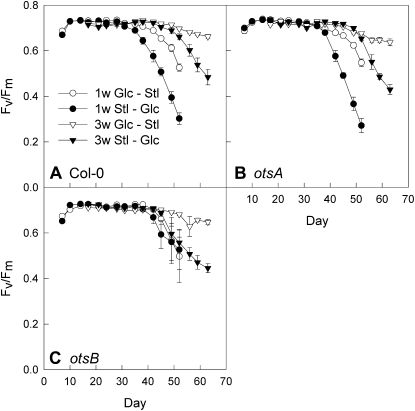
Trehalose 6-phosphate (T6P) is an important regulator of plant metabolism and development. T6P content increases when carbon availability is high, and in young growing tissue, T6P inhibits the activity of Snf1-related protein kinase (SnRK1). Here, strong accumulation of T6P was found in senescing leaves of Arabidopsis (Arabidopsis thaliana), in parallel with a rise in sugar contents. To determine the role of T6P in senescence, T6P content was altered by expressing the bacterial T6P synthase gene, otsA (to increase T6P), or the T6P phosphatase gene, otsB (to decrease T6P). In otsB-expressing plants, T6P accumulated less strongly during senescence than in wild-type plants, while otsA-expressing plants contained more T6P throughout. Mature otsB-expressing plants showed a similar phenotype as described for plants overexpressing the SnRK1 gene, KIN10, including reduced anthocyanin accumulation and delayed senescence. This was confirmed by quantitative reverse transcription-polymerase chain reaction analysis of senescence-associated genes and genes involved in anthocyanin synthesis. To analyze if the senescence phenotype was due to decreased sugar sensitivity, the response to sugars was determined. In combination with low nitrogen supply, metabolizable sugars (glucose, fructose, or sucrose) induced senescence in wild-type and otsA-expressing plants but to a smaller extent in otsB-expressing plants. The sugar analog 3-O-methyl glucose, on the other hand, did not induce senescence in any of the lines. Transfer of plants to and from glucose-containing medium suggested that glucose determines senescence during late development but that the effects of T6P on senescence are established by the sugar response of young plants.
Figures
Similar articles
-
Trehalose 6-Phosphate Positively Regulates Fatty Acid Synthesis by Stabilizing WRINKLED1.Plant Cell. 2018 Oct;30(10):2616-2627. doi: 10.1105/tpc.18.00521. Epub 2018 Sep 24. Plant Cell. 2018. PMID: 30249634 Free PMC article.
-
Altering trehalose-6-phosphate content in transgenic potato tubers affects tuber growth and alters responsiveness to hormones during sprouting.Plant Physiol. 2011 Aug;156(4):1754-71. doi: 10.1104/pp.111.179903. Epub 2011 Jun 13. Plant Physiol. 2011. PMID: 21670224 Free PMC article.
-
The trehalose 6-phosphate/SnRK1 signaling pathway primes growth recovery following relief of sink limitation.Plant Physiol. 2013 Jul;162(3):1720-32. doi: 10.1104/pp.113.220657. Epub 2013 Jun 4. Plant Physiol. 2013. PMID: 23735508 Free PMC article.
-
Metabolism control over growth: a case for trehalose-6-phosphate in plants.J Exp Bot. 2012 May;63(9):3379-90. doi: 10.1093/jxb/err311. Epub 2011 Nov 4. J Exp Bot. 2012. PMID: 22058405 Review.
-
How do sugars regulate plant growth and development? New insight into the role of trehalose-6-phosphate.Mol Plant. 2013 Mar;6(2):261-74. doi: 10.1093/mp/sss120. Epub 2012 Oct 25. Mol Plant. 2013. PMID: 23100484 Review.
Cited by
-
Two Nucleoporin98 homologous genes jointly participate in the regulation of starch degradation to repress senescence in Arabidopsis.BMC Plant Biol. 2020 Jun 26;20(1):292. doi: 10.1186/s12870-020-02494-1. BMC Plant Biol. 2020. PMID: 32586274 Free PMC article.
-
The redox-sensitive chloroplast trehalose-6-phosphate phosphatase AtTPPD regulates salt stress tolerance.Antioxid Redox Signal. 2014 Sep 20;21(9):1289-304. doi: 10.1089/ars.2013.5693. Epub 2014 Jun 26. Antioxid Redox Signal. 2014. PMID: 24800789 Free PMC article.
-
Carbon/Nitrogen Imbalance Associated with Drought-Induced Leaf Senescence in Sorghum bicolor.PLoS One. 2015 Aug 28;10(8):e0137026. doi: 10.1371/journal.pone.0137026. eCollection 2015. PLoS One. 2015. PMID: 26317421 Free PMC article.
-
Comprehensive investigation of tobacco leaves during natural early senescence via multi-platform metabolomics analyses.Sci Rep. 2016 Nov 29;6:37976. doi: 10.1038/srep37976. Sci Rep. 2016. PMID: 27897248 Free PMC article.
-
The Release of Organic Acids and Low Molecular Weight Carbohydrates from Matcha Tea After In Vitro Digestion.Nutrients. 2024 Nov 26;16(23):4058. doi: 10.3390/nu16234058. Nutrients. 2024. PMID: 39683452 Free PMC article.
References
-
- Baena-González E, Rolland F, Thevelein JM, Sheen J. (2007) A central integrator of transcription networks in plant stress and energy signalling. Nature 448: 938–942 - PubMed
-
- Blázquez MA, Santos E, Flores CL, Martínez-Zapater JM, Salinas J, Gancedo C. (1998) Isolation and molecular characterization of the Arabidopsis TPS1 gene, encoding trehalose-6-phosphate synthase. Plant J 13: 685–689 - PubMed
-
- Buchanan-Wollaston V, Page T, Harrison E, Breeze E, Lim PO, Nam HG, Lin JF, Wu SH, Swidzinski J, Ishizaki K, et al. (2005) Comparative transcriptome analysis reveals significant differences in gene expression and signalling pathways between developmental and dark/starvation-induced senescence in Arabidopsis. Plant J 42: 567–585 - PubMed
Publication types
MeSH terms
Substances
Grants and funding
LinkOut - more resources
Full Text Sources
Molecular Biology Databases
