. 2012;7(1):e29035.
doi: 10.1371/journal.pone.0029035. Epub 2012 Jan 11.

Two lysines in the forkhead domain of foxp3 are key to T regulatory cell function

Affiliations

Two lysines in the forkhead domain of foxp3 are key to T regulatory cell function

Yujie Liu et al. PLoS One. 2012.

Abstract

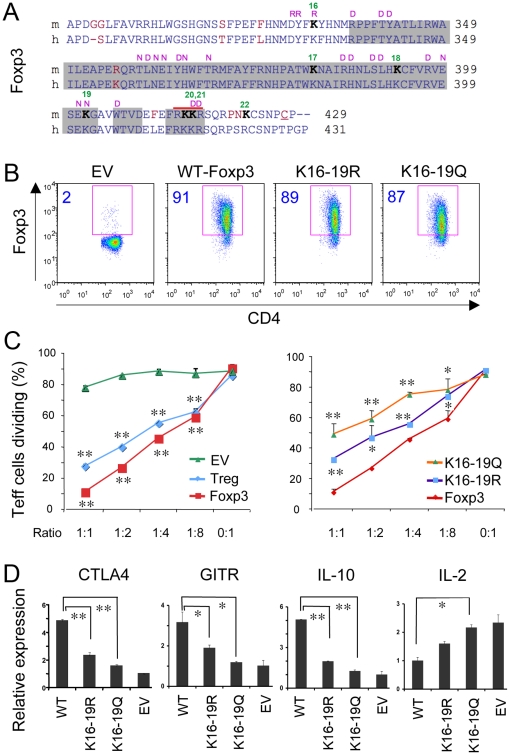
Background: The forkhead box transcription factor, Foxp3, is master regulator of the development and function of CD4+CD25+ T regulatory (Treg) cells that limit autoimmunity and maintain immune homeostasis. The carboxyl-terminal forkhead (FKH) domain is required for the nuclear localization and DNA binding of Foxp3. We assessed how individual FKH lysines contribute to the functions of Foxp3 in Treg cells.

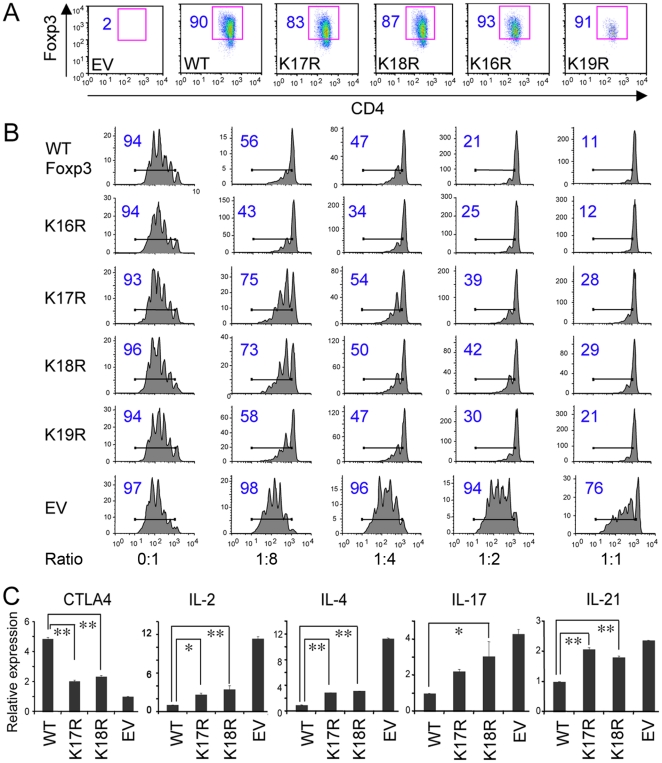
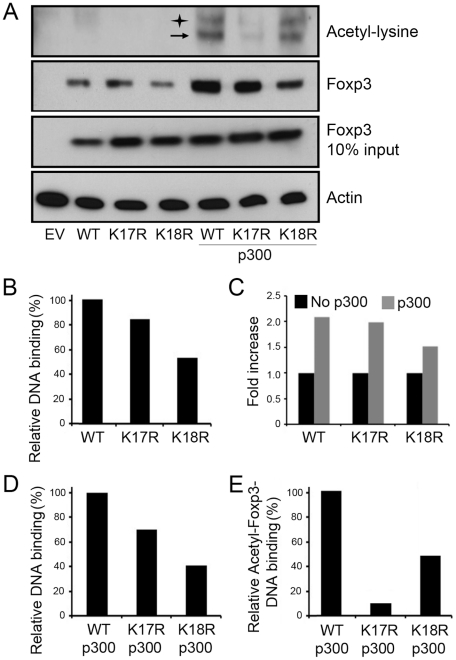
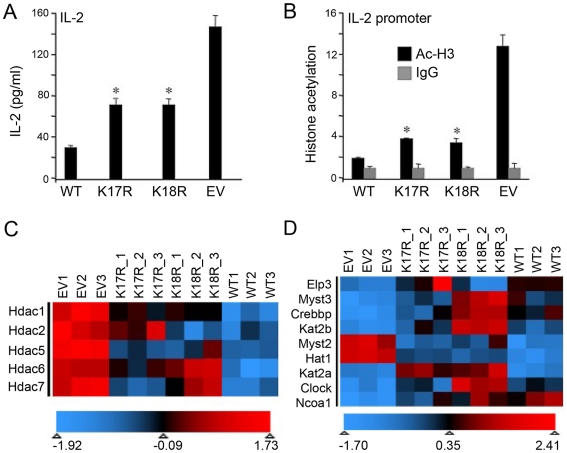
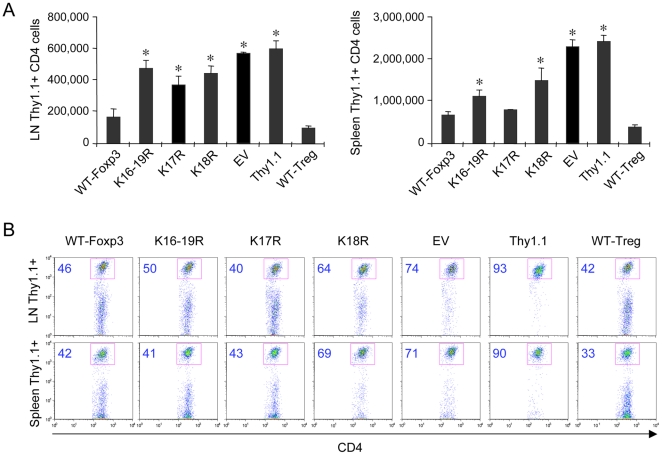
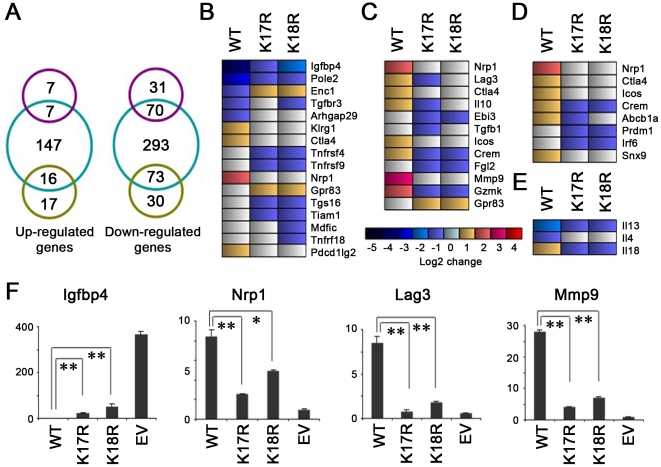
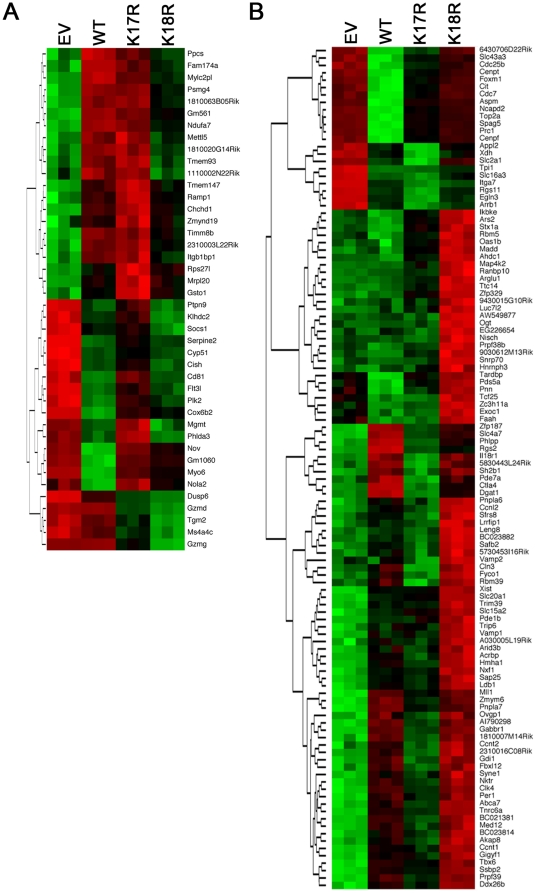
Methodology/principal findings: We found that mutation of FKH lysines at position 382 (K17) and at position 393 (K18) impaired Foxp3 DNA binding and inhibited Treg suppressive function in vivo and in vitro. These lysine mutations did not affect the level of expression of Foxp3 but inhibited IL-2 promoter remodeling and had important and differing effects on Treg-associated gene expression.

Conclusions/significance: These data point to complex effects of post-translational modifications at individual lysines within the Foxp3 FKH domain that affect Treg function. Modulation of these events using small molecule inhibitors may allow regulation of Foxp3+ Treg function clinically.


Conflict of interest statement

Competing Interests: The authors have declared that no competing interests exist.

Figures

Figure 1
Figure 1. Foxp3 lysine mutations affect Treg suppressive function and gene expression.
(A) Comparison of amino acid sequences of the C-terminal regions of mouse (m) and human (h) Foxp3, with FKH domains in gray. Lysine at position 332 is K16 and the FKH domain contains K17–K21 (consecutive lysines numbered in green), with residues important for Runx1 (R), DNA (D) or NFAT (N) binding indicated in purple and non-conserved residues shown in red; adapted from . (B) CD4+CD25 T cells were transduced with retroviruses encoding WT Foxp3, Foxp16-19R, Foxp16-19Q or EV; Foxp3 staining showed >85% transduction efficiency (%transduced cells shown in blue in each panel). (C) In vitro Treg suppression assays in which 5×10⁵ CFSE-labeled Teff cells were stimulated for 72 h with CD3 mAb in the presence of 5×10⁵ irradiated APC and the indicated ratios of Treg to Teff cells. Data are mean ± SD of duplicate measurements of the percentages of dividing Teff cells, and results are representative of 3 independent experiments; *p value<0.05, **p<0.01 compared to empty vector (EV) in left panel or compared to WT Foxp3 in right panel. (D) RNA derived from CD4+CD25 T cells transduced with WT Foxp3, Foxp3 K16-19R, K16-19Q or EV were analyzed for CTLA4, GITR, IL-2, and IL-10 gene expression by qPCR and data were normalized to 18S; *p value<0.05, **p<0.01 compared to WT Foxp3. Graphs show means ± SD and results are representative of 3 independent experiments.
Figure 2
Figure 2. Single Foxp3 lysine mutations affect Treg suppressive function and gene expression.
(A) CD4+ CD25− T cells transduced with retroviruses encoding WT Foxp3, K16R, K17R, K18R, K19R or EV; Foxp3 staining showed >80% transduction efficiency. (B) Effects of single lysine mutations on Treg suppressive activity. (C) RNA derived from CD4+CD25− T cells transduced with WT Foxp3, K17R, K18R or EV were analyzed for CTLA4 (in the absence of CD3/CD28 mAbs) and IL-2, IL-4, IL-17 and IL-21 (in the presence of CD3/CD28 mAbs) gene expression by qPCR. Data were normalized to 18S; *p<0.05, **p<0.01 compared to WT Foxp3. Graphs show means ± SD and results are representative of 3 independent experiments.
Figure 3
Figure 3. Foxp3 mutants impair Foxp3 DNA binding ability.
293T cells were transfected with EV, WT Foxp3, K17R or K18R without or with p300 expression vectors, and 48 h later, cell lysates were harvested. (A) Equal amounts of cell lysates were incubated with biotin-labeled Foxp3 binding site nucleotide, and Foxp3 DNA binding was detected with anti-Foxp3 or anti-acetyl-lysine Abs. The protein expression levels of Foxp3 and loading control β-actin were detected by western blotting; arrow indicates acetylated Foxp3 bound to DNA, and star indicates non-specific binding. (B–D) The densities of Foxp3 DNA-binding bands were measured using Image-J software and normalized with Foxp3 input levels. (B) The relative Foxp3 DNA binding ability in the absence of p300 is shown. (C) Foxp3 and mutant DNA binding ability was increased in the presence of p300. (D) Comparison of relative Foxp3 DNA binding between WT and mutants in the presence of p300 is shown. (E) Comparison of relative acetylated Foxp3 binding level between WT and mutants is shown. Results are representative of 2 independent experiments.
Figure 4
Figure 4. Foxp3 mutations affect chromatin remodeling and HDAC and HAT expression.
CD4+ T cells transduced with WT Foxp3, K17R, K18R or EV were cultured in medium with CD3/CD28 mAb for 20 h. (A) IL-2 levels were detected by ELISA. (B) Chromatin extracts were precipitated with anti-AcH3 Ab or control IgG, and probed for the promoter regions of IL-2 and genes levels were determined by qPCR. Results (mean ± SD) in panels A and B are representative of 3 independent experiments, and *p<0.05, **p<0.01 compared to WT Foxp3. Heat maps indicating distinct expression profiles of genes encoding (C) HDAC and (D) HAT enzymes. Microarray experiments were performed using whole-mouse-genome oligoarrays (Mouse430a; Affymetrix), and array data were analyzed using MAYDAY 2.12 software . Array data were subjected to robust multiarray average normalization. Normalized data were used for calculating fold changes of up- and downregulated genes using Student's test, and data with >2x differential expression (p<0.05 with Storey's FDR<0.1) were included in the analysis. Data underwent z-score transformation for display.
Figure 5
Figure 5. Foxp3 mutants impair Treg function in vivo.
(A) 1×10⁶ Thy1.1+ CD4+CD25− T cells were co-transferred with 1×10⁶ Thy1.2+ CD4+ T cells transduced with WT Foxp3, K16-19R, K17R, K18R or EV, or with purified normal B6 Treg cells, into Rag1−/− mice. At 7 d post-transfer, single-cell suspensions from lymph node or spleen samples were stained for FACS analyses; the numbers (A) or percentages (B) of CD4+ Thy1.1+ cells are shown. Results are representative of 2 independent experiments, and *p<0.05 compared to WT Foxp3.
Figure 6
Figure 6. Comparison of gene expression profiles of CD4+ T cells transduced with WT Foxp3, K17R, K18R or EV.
(A) Venn diagrams summarizing overlapping upregulated (left) or downregulated (right) gene expression profiles of CD4+ T cells transduced with WT Foxp3 (blue), K17R (purple) or K18R (yellow) compared with CD4+ T cells transduced with EV (cutoff was set as Log2 fold >1). (B–E) Heat maps showing gene expression profiles of CD4+ T cells transduced with EV, WT Foxp3, K17R or K18R. (B) Heat maps showing distinct Treg ‘signature’ gene expression profiles. (C) Heat maps indicating the change in gene expression profiles of Treg cell identified and putative suppressive genes. (D) Heat maps indicating the distinct gene expression profiles of Foxp3 directly bound genes. (E) Heat maps indicating distinct gene expression profiles of Treg-related cytokine genes. (F) qPCR assays of Treg-specific genes selected from microarray analyses; results are representative of 3 independent experiments, and *p<0.05, **p<0.01 compared to WT Foxp3.
Figure 7
Figure 7. Comparison of gene expression profiles of CD4+ T cells transduced with Foxp3 K17R versus K18R.
Heat maps showing distinct gene expression profiles of CD4+ T cells transduced with WT Foxp3, K17R, K18R or EV.

References

    1. Vignali DA, Collison LW, Workman CJ. How regulatory T cells work. Nat Rev Immunol. 2008;8:523–532. - PMC - PubMed
    1. Feuerer M, Hill JA, Mathis D, Benoist C. Foxp3+ regulatory T cells: differentiation, specification, subphenotypes. Nat Immunol. 2009;10:689–695. - PubMed
    1. Hori S, Nomura T, Sakaguchi S. Control of regulatory T cell development by the transcription factor Foxp3. Science. 2003;299:1057–1061. - PubMed
    1. Fontenot JD, Rasmussen JP, Williams LM, Dooley JL, Farr AG, et al. Regulatory T cell lineage specification by the forkhead transcription factor foxp3. Immunity. 2005;22:329–341. - PubMed
    1. Khattri R, Cox T, Yasayko SA, Ramsdell F. An essential role for Scurfin in CD4+CD25+ T regulatory cells. Nat Immunol. 2003;4:337–342. - PubMed

Publication types

MeSH terms