

Magnetic resonance imaging of the temporomandibular joint disc: feasibility of novel quantitative magnetic resonance evaluation using histologic and biomechanical reference standards
- PMID: 22247930
- PMCID: PMC4048068
Magnetic resonance imaging of the temporomandibular joint disc: feasibility of novel quantitative magnetic resonance evaluation using histologic and biomechanical reference standards
Abstract
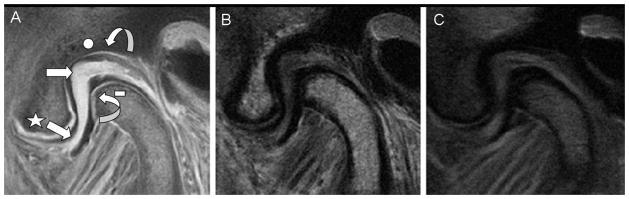
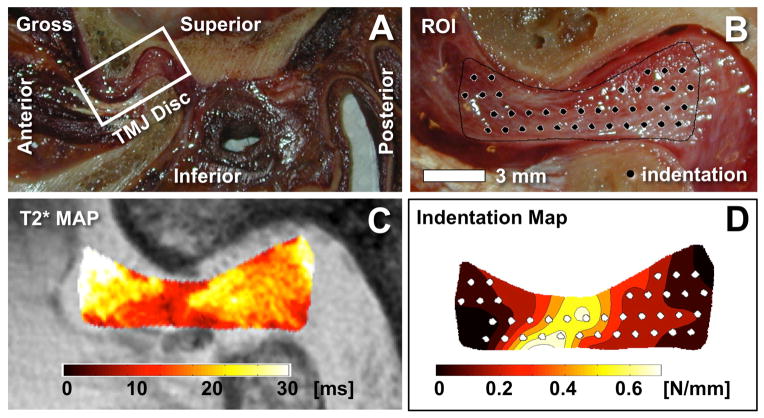
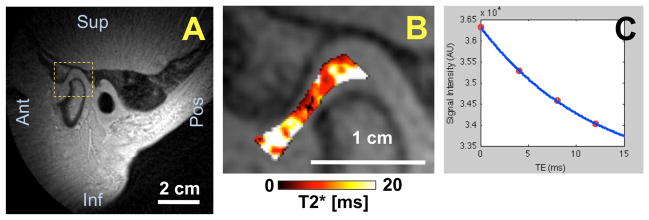
Aims: To use the ultrashort time-to-echo magnetic resonance imaging (UTE MRI) technique to quantify short T2* properties (obtained through gradient echo) of a disc from the human temporomandibular joint (TMJ) and to corroborate regional T2* values with biomechanical properties and histologic appearance of the discal tissues.
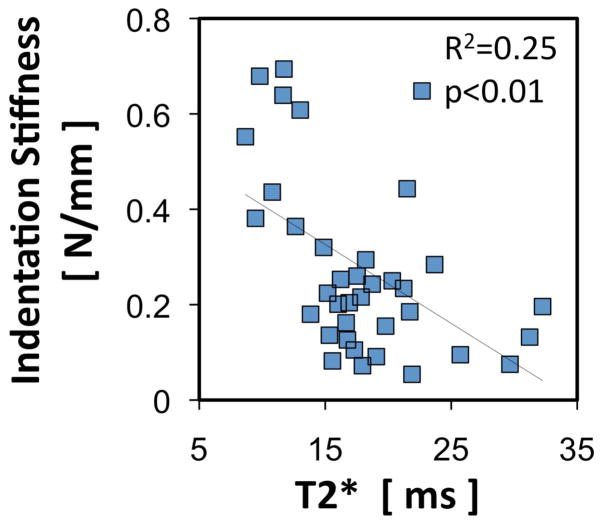
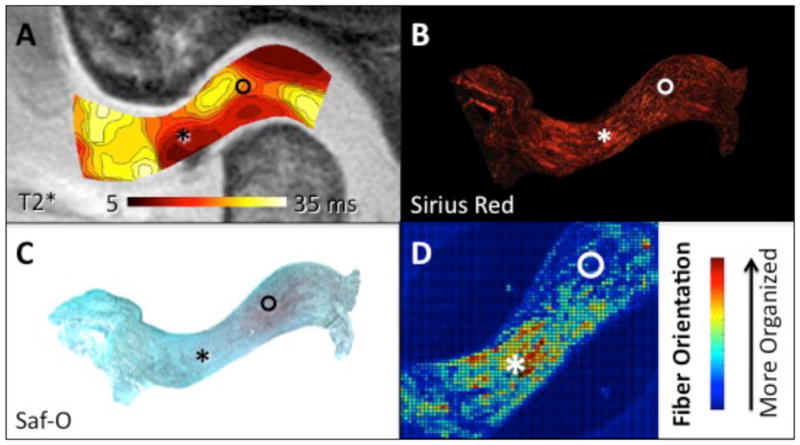
Methods: A cadaveric human TMJ was sliced sagittally and imaged by conventional and UTE MRI techniques. The slices were then subjected to either biomechanical indentation testing or histologic evaluation, and linear regression was used for comparison to T2* maps obtained from UTE MRI data. Feasibility of in vivo UTE MRI was assessed in two human volunteers.
Results: The UTE MRI technique of the specimens provided images of the TMJ disc with greater signal-to-noise ratio (~3 fold) and contrast against surrounding tissues than conventional techniques. Higher T2* values correlated with lower indentation stiffness (softer) and less collagen organization as indicated by polarized light microscopy. T2* values were also obtained from the volunteers.
Conclusion: UTE MRI facilitates quantitative characterization of TMJ discs, which may reflect structural and functional properties related to TMJ dysfunction.
Figures
References
-
- Alomar X, Medrano J, Cabratosa J, Clavero JA, Lorente M, Serra I, et al. Anatomy of the temporomandibular joint. Semin Ultrasound CT MR. 2007;28:170–183. - PubMed
-
- Hayt MW, Abrahams JJ, Blair J. Magnetic resonance imaging of the temporomandibular joint. Top Magn Reson Imaging. 2000;11:138–146. - PubMed
-
- Klasser GD, Greene CS. The changing field of temporomandibular disorders: what dentists need to know. J Can Dent Assoc. 2009;75:49–53. - PubMed
-
- Ahmad M, Hollender L, Anderson Q, Kartha K, Ohrbach R, Truelove EL, et al. Research diagnostic criteria for temporomandibular disorders (RDC/TMD): development of image analysis criteria and examiner reliability for image analysis. Oral Surg Oral Med Oral Pathol Oral Radiol Endod. 2009;107:844–860. - PMC - PubMed
-
- Ren YF, Westesson PL, Isberg A. Magnetic resonance imaging of the temporomandibular joint: value of pseudodynamic images. Oral Surg Oral Med Oral Pathol Oral Radiol Endod. 1996;81:110–123. - PubMed
Publication types
MeSH terms
Substances
Grants and funding
LinkOut - more resources
Full Text Sources
Medical