. 2012 Apr 15;443(2):463-76.
doi: 10.1042/BJ20111255.

CNGA3 is expressed in inner ear hair cells and binds to an intracellular C-terminus domain of EMILIN1

Affiliations

CNGA3 is expressed in inner ear hair cells and binds to an intracellular C-terminus domain of EMILIN1

Dakshnamurthy Selvakumar et al. Biochem J. .

Abstract

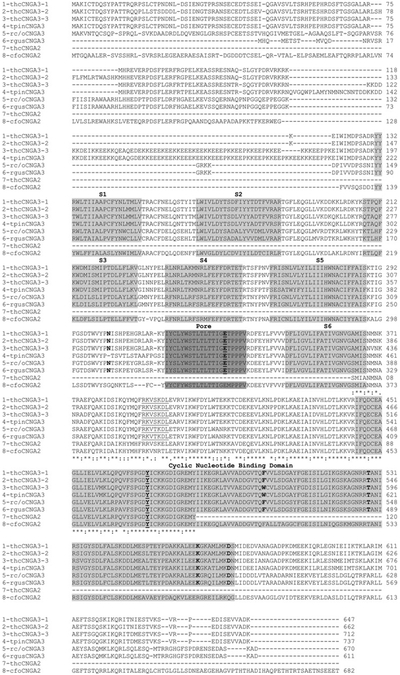
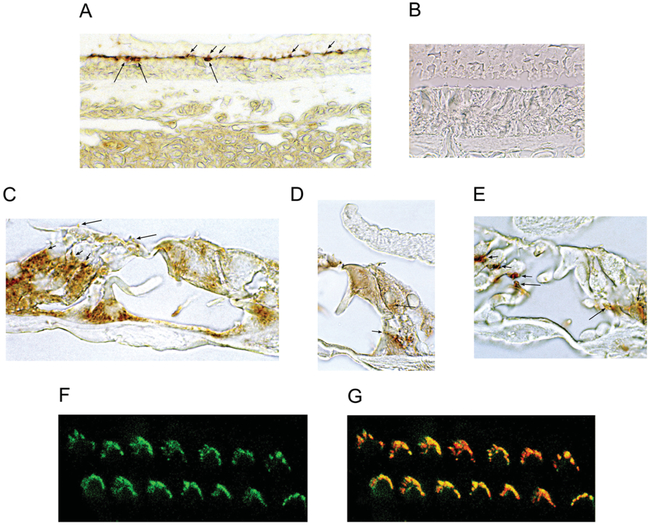
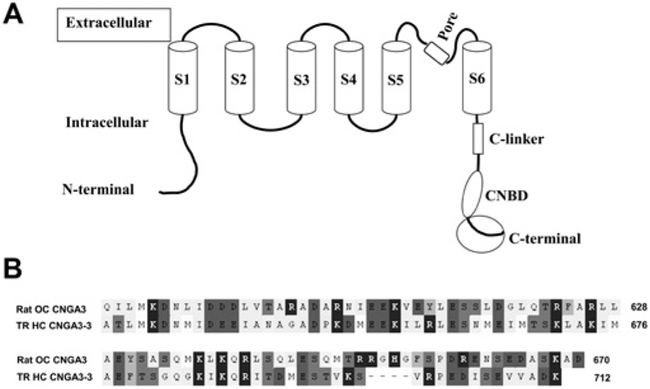
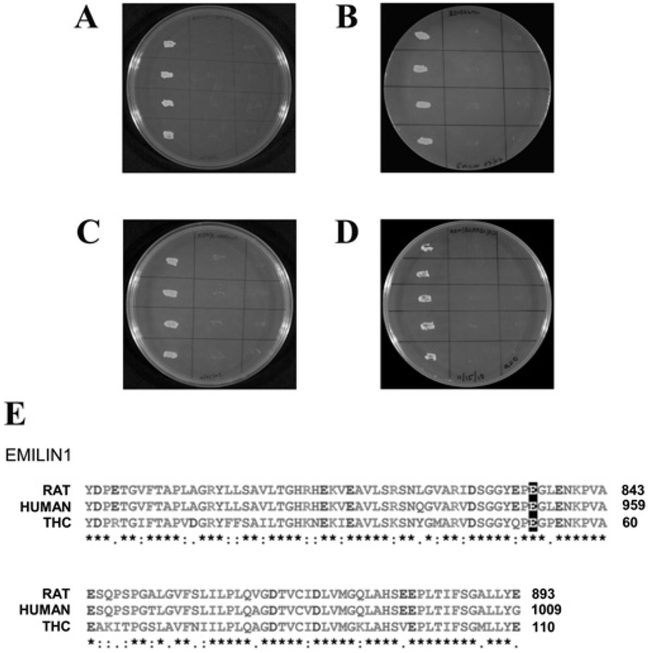
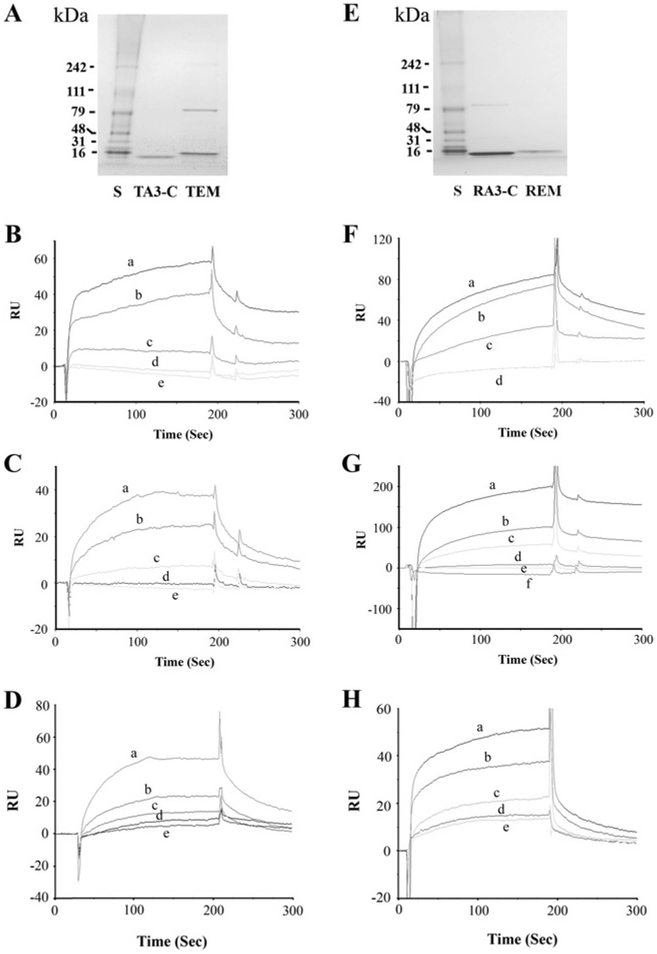
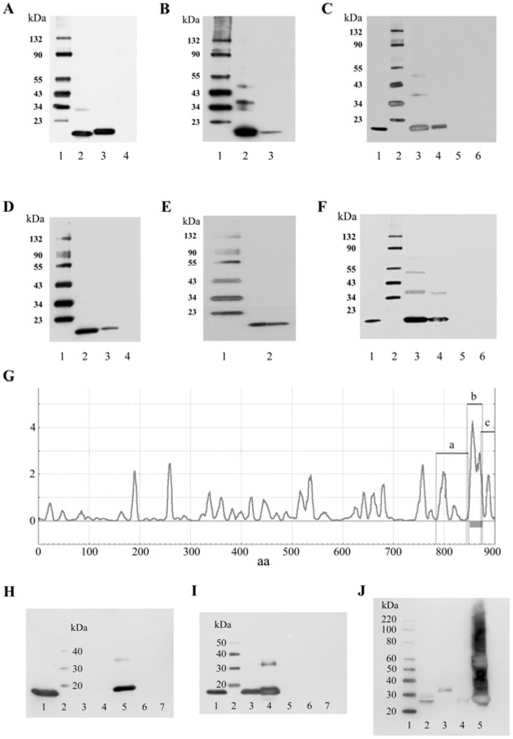
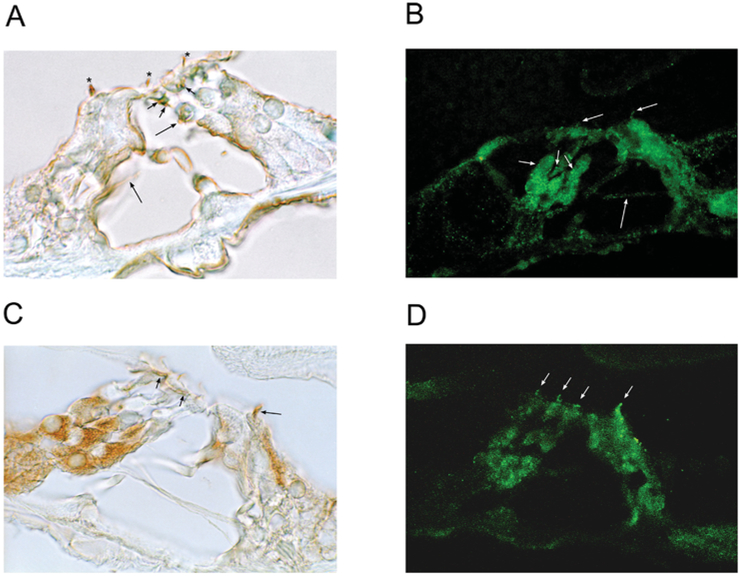
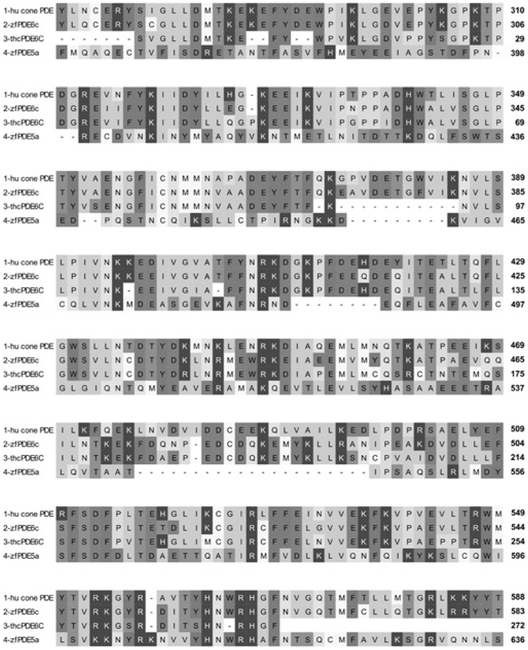
The molecular characteristics of CNG (cyclic nucleotide-gated) channels in auditory/vestibular hair cells are largely unknown, unlike those of CNG mediating sensory transduction in vision and olfaction. In the present study we report the full-length sequence for three CNGA3 variants in a hair cell preparation from the trout saccule with high identity to CNGA3 in olfactory receptor neurons/cone photoreceptors. A custom antibody targeting the N-terminal sequence immunolocalized CNGA3 to the stereocilia and subcuticular plate region of saccular hair cells. The cytoplasmic C-terminus of CNGA3 was found by yeast two-hybrid analysis to bind the C-terminus of EMILIN1 (elastin microfibril interface-located protein 1) in both the vestibular hair cell model and rat organ of Corti. Specific binding between CNGA3 and EMILIN1 was confirmed with surface plasmon resonance analysis, predicting dependence on Ca2+ with Kd=1.6×10⁻⁶ M for trout hair cell proteins and Kd=2.7×10⁻⁷ M for organ of Corti proteins at 68 μM Ca2+. Pull-down assays indicated that the binding to organ of Corti CNGA3 was attributable to the EMILIN1 intracellular sequence that follows a predicted transmembrane domain in the C-terminus. Saccular hair cells also express the transcript for PDE6C (phosphodiesterase 6C), which in cone photoreceptors regulates the degradation of cGMP used to gate CNGA3 in phototransduction. Taken together, the evidence supports the existence in saccular hair cells of a molecular pathway linking CNGA3, its binding partner EMILIN1 (and β1 integrin) and cGMP-specific PDE6C, which is potentially replicated in cochlear outer hair cells, given stereociliary immunolocalizations of CNGA3, EMILIN1 and PDE6C.


Figures

Figure 1
Figure 1. Clustal sequence alignment of the three trout saccular hair cell CNGA3 subtypes
Line 1, trout hair cell (thc) CNGA3-1 (GenBank® accession number HQ542177). Line 2, trout hair cell CNGA3-2 (GenBank® accession number HQ542178). Line 3, trout hair cell CNGA3-3 (GenBank® accession number HQ542179). Line 4, trout pineal photoreceptor (tpin) CNGA3 (GenBank® accession number AF393839). Line 5, rat cone/olfactory (rc/o) CNGA3 (GenBank® accession number EDL992404 for olfactory protein sequence). Line 6, rat gustatory (rgus) CNGA3 (GenBank® accession number NM_053495). Line 7, trout hair cell CNGA2. Line 8, catfish olfactory (cfo) CNGA2 (GenBank® accession number P55934 for protein sequence). The six transmembrane domains, S1–S6 (light grey), the pore region between S5 and S6 (dark grey) and the CNBD (light grey) are highlighted. The Clustal designations for identity and homology across CNGA3 and CNGA2 sequences are indicated starting at residue 429 and finishing at residue 547 (CNGA3-3). Also in bold and/or underlined are amino acid residues believed to have specific functions in higher vertebrates and which are conserved in the trout hair cell CNGA3 sequence, with numbering according to that of CNGA3-3: N-glycosylation site, Asn367 putatively affecting pore function; predicted PKA site, RKVSKDL in C-linker, amino acids 455–461; Cys513, affecting coupling of cGMP to the pore; Tyr536 within the CNBD, a putative phosphorylation site conserved across CNG subunits in higher vertebrates; Trp566, Thr593, Lys629 and Asp637 within the CNBD represent amino acids thought to be important in specifying cGMP sensitivity in CNGA1 and CNGA3 channels.
Figure 2
Figure 2. Immunoreactivity for CNGA3 in the trout saccule and rat and mouse organ of Corti
(A) A custom antibody (Covance) was developed in chick against an N-terminal epitope of trout saccular hair cell CNGA3. This primary antibody was used at 1:100 000 dilution, coupled with a biotinylated goat anti-chick IgY secondary antibody, and detected with DAB. CNGA3 immunoreactivity was observed in saccular hair cell stereociliary arrays (short arrows) and in corresponding subcuticular plate sites (long arrows). (B) Negative control showing hair cell sensory epithelium in trout saccule with no primary antibody present, but secondary antibody included. (C) In the organ of Corti of the adult rat, immunoreactivity for CNGA3 was detected in efferent endings at the base of outer hair cells (short arrows) and in outer hair stereocilia (long arrows). (D) Beneath the inner hair cell of the ratorgan of Corti, CNGA3 immunoreactivity was observed in efferent nerve fibres above the habenula perforata crossing the inner pillar cell to enter the tunnel of Corti (short arrows) before crossing through the tunnel to end on outer hair cells and on Deiters’ cells. CNGA3 immunoreactivity was also detected at the base of the inner hair cell (long arrow). (E) In mouse organ of Corti, CNGA3 immunoreactivity was found in efferent tunnel crossing fibres (long arrows) and in efferent nerve endings at the base of outer hair cells (short arrows). (F) In Z-stack confocal microscopy, CNGA3 immunofluorescence (green) was associated with outer hair cell stereociliary arrays and in (G) overlapping phalloidin (red) labelling of F-actin in a 1 μm optical section (overlap in yellow) of mouse cochlea.
Figure 3
Figure 3. CNGA3 C-termini in rat and trout
(A) Schematic depiction of CNGA3 with S1–S6 transmembrane regions, connecting intracellular and extracellular sequence, the C-linker, CNBD and the cytoplasmic C-terminal sequence (encircled). S4 represents the voltage sensor. (B) Alignment (with OMIGA 2.0) of the cytoplasmic C-terminal sequences of rat organ of Corti CNGA3 (amino acid numbering according to GenBank® accession number AJ272428) and trout saccular hair cell CNGA3-3 (HQ542179) used as bait in yeast two-hybrid protocols and in pull-down and SPR analyses.
Figure 4
Figure 4. Interaction of trout hair cell CNGA3-3 C-terminus with EMILIN1
(A) First lane, binding of trout CNGA3-3 as bait to EMILIN1-like protein as prey, determined on quadruple drop-out medium with yeast two-hybrid co-transformation protocols. Second lane, negative control with CNGA3-3 as bait and empty vector as prey. Third lane, negative control with empty vector as bait and EMILIN1 as prey. (B) Reversal of bait and prey. First lane, EMILIN1 as bait and CNGA3–3 as prey. Second lane, negative control with EMILIN1 as bait and empty vector as prey. Third lane, negative control with empty vector as bait and CNGA3–3 as prey. (C) The C-terminus of rat CNGA3 as bait and rat EMILIN1 as prey in selection medium SD/–Trp/–Leu/–His/–Ade. First lane, interaction between bait and prey fusion peptides. Second lane, negative control with rat CNGA3 as bait and empty vector as prey. Third lane, negative control with empty vector as bait and EMILIN1 as prey. (D) Reversal of bait and prey. First lane, rat EMILIN1 as bait and CNGA3-C as prey. Second lane, negative control with EMILIN1 as bait and empty vector as prey. Third lane, negative control, with empty vector as bait and CNGA3-C as prey. (E) Clustal alignment of EMILIN1 in rat, human and trout saccular hair cells (THC). Alignment illustrating that trout EMILIN1 prey sequence is 74% identical with rat and human EMILIN1 (GenBank® accession numbers NP_001100180 and NP_008977 respectively). The highlighted glutamate residues (E) correspond to Glu993 in human EMILIN1, required for binding of EMILIN1 to integrin α4β1.
Figure 5
Figure 5. SPR analysis of binding interaction between CNGA3 and EMILIN1
(A) Coomassie Blue detection of affinity-purified fusion proteins. S, pre-stained protein standards with molecular masses indicated to the left (kDa) on an SDS/PAGE gel (Bench-Mark, Invitrogen). TA3-C, affinity-purified C-terminus of trout hair cell CNGA3-3 fusion protein at 13 kDa. TEM, C-terminus of trout EMILIN1 fusion protein at 16 kDa. (B) Binding of TA3-C as ligand to TEM as analyte (100 nM), enhanced by Ca2+ . Response units (RU) are indicated for binding at 68 μMCa2+ (a), 26.5 μM Ca2+ (b), and 1 mM EGTA (c), compared with the response for 10 mM Hepes, pH 7.4, and 150 mM NaCl (HBS-N) plus 1mM EGTA (d) or HBS-N buffer alone (e). (C) Binding of TEM as ligand to TA3-C as analyte (100 nM) increases with elevation of Ca2+ . Response units are indicated for binding at 68 μM Ca2+ (a), 26.5 μM Ca2+ (b) and 1 mM EGTA (c), compared with the response for HBS-N plus 1mM EGTA (d) or HBS-N buffer alone (e). (D) Kinetics of binding between TEM as ligand and TA3-C as analyte, at 68 μM Ca2+ and 10 (e), 20 (d), 40 (c), 80 (b) or 160 (a) nM analyte. Kd = 1.6×10 −6 M. (E) Affinity-purified rat fusion proteins stained with Coomassie Blue. S, pre-stained protein standards with molecular masses indicated to the left (kDa) on an SDS/PAGE gel. RA3-C, affinity purified C-terminus of CNGA3 fusion protein at 14 kDa. REM, C-terminus of EMILIN1 fusion protein at 16 kDa. (F) Ca2+ -dependence of the interaction of REM as ligand and RA3-C as analyte (100 nM). Response units are indicated for binding at 68 μM Ca2+ (a), 26.5 μM Ca2+ (b) and 1 mM EGTA (c), compared with the response for HBS-N plus 1 mM EGTA (d) or overlapping plot for HBS-N buffer alone (d). (G) Ca2+ -dependence of the response for the reverse interaction of rat RA3-C as ligand with REM as analyte (100 nM). Response units (RU) are indicated for binding with REM at 166 μM Ca2+ (a), 68 μM Ca2+ (b), 26.5 μM Ca2+ (c) and 1 mM EGTA (d), compared with the response for HBS-N plus 1 mM EGTA (e) or HBS-N buffer alone (f). (H) Kinetics of binding between REM as ligand and RA3-C as analyte, at 68 μM Ca2+ and 10 (e), 20 (d), 40 (c), 80 (b) and 160 (a) nM analyte. Kd = 2.7×10⁻⁷ M.
Figure 6
Figure 6. GST pull-down assays of binding between CNGA3 and EMILIN1 for trout saccular hair cell and rat organ of Corti proteins
(A) Western blot of trout hair cell CNGA3-3 (TA3-C) and EMILIN1 (TEM) C-terminus fusion proteins expressed in pRSET-A and detected with anti-Xpress monoclonal antibody (Invitrogen). Lane 1, protein standards with molecular masses indicated to the left-hand side in kDa. Lane 2, affinity-purified TA3-C fusion protein at 13 kDa. Lane 3, affinity-purified TEM fusion protein at 16 kDa. Lane 4, pRSET-A bacterial lysate as negative control. (B) Western blot of rat EMILIN1 (REM) and trout EMILIN1 detected with an anti-EMILIN1 mouse monoclonal antibody (Abnova) which has cross-reactivity for rat and trout sequence. Lane 1, protein standards with molecular masses indicated to the left-hand side in kDa. Lane 2, affinity-purified REM fusion protein at 16 kDa. Lane 3, affinity-purified TEM fusion protein at 16 kDa. (C) GST pull-down assay of binding between TA3-C and TEM-like protein. Lane 1, purified TEM fusion product used in the pull-down assay, detected with anti-Xpress monoclonal antibody. Lane 2, protein standards with molecular masses indicated to the left-hand side in kDa. Lane 3, binding of TEM fusion protein (~300 ng) with GST–TA3-C cleared lysate, pulled down with glutathione–Sepharose, and detected with anti-Xpress antibody. Lane 4, binding of TEM fusion protein (~100 ng) with GST–TA3-C lysate. Lane 5, TEM (~300 ng) incubated with GST bacterial lysate as a negative control. Lane 6, TEM fusion protein mixed with Sepharose beads under the same conditions as above, representing another negative control. (D) Western blot of the C-termini of rat CNGA3 (RA3-C) and EMILIN1 (REM) fusion proteins in pRSET-A detected with anti-Xpress antibody. Lane 1, protein standards with molecular masses indicated to the left-hand side in kDa. Lane 2, affinity-purified rat organ of Corti RA3-C fusion protein at 14 kDa. Lane 3, affinity-purified REM fusion protein at 16 kDa. Lane 4, pRSET-A bacterial lysate as negative control. (E) Western blot of CNGA3 C-terminus fusion protein (RA3-C) in pRSET-A. Lane 1, protein standards with molecular masses indicated to the left-hand side in kDa. Lane 2, affinity-purified rat organ of Corti CNGA3 (RA3-C) fusion protein at 14 kDa, detected with anti-CNGA3 rabbit polyclonal antibody (Alomone). (F) GST pull-down assay of binding between RA3-C and REM. Lane 1, purified REM fusion protein used in the pull-down assay, detected with anti-Xpress antibody. Lane 2, protein standards with molecular masses indicated to the left-hand side in kDa. Lane 3, binding of REM fusion protein (~300 ng) with GST–RA3-C cleared lysate, pulled down with glutathione–Sepharose, and detected with anti-Xpress antibody. Lane 4, binding of REM fusion protein (~100 ng) with GST–RA3-C lysate. Lane 5, REM (~300 ng) incubated with GST bacterial lysate as a negative control. Lane 6, REM fusion protein mixed with Sepharose beads under the same conditions as above, representing another negative control. (G) Transmembrane helix preference for rat EMILIN1 (GenBank® accession number NP_001100180.1) with predicted transmembrane domain b (amino acids 846–876), before-transmembrane segment a (amino acids 784–849) and after-transmembrane segment c (amino acids 873–900). (H) Pull-down assay for segments of the C-terminus of EMILIN1 in GST and CNGA3. Lane 1, CNGA3 C-terminus detected with anti-Xpress, 14 kDa. Lane 2, protein standards (LC5603, Invitrogen) with molecular masses indicated to the left-hand side in kDa. Lane 3, region before-transmembrane domain (a) plus CNGA3 detected with anti-Xpress. Lane 4, transmembrane domain (b) plus CNGA3. Lane 5, region after-transmembrane domain (c) plus CNGA3. Lane 6, CNGA3 plus GST lysate negative control. Lane 7, CNGA3 plus GST beads, negative control. (I) Lane 1, CNGA3 C-terminus detected with anti-Xpress, 14 kDa. Lane 2, protein standards with molecular masses indicated to the left-hand side in kDa, Invitrogen. Lane 3, pull-down of 100 ng purified CNGA3 with EMILIN1 c. Lane 4, pull-down of 200 ng purified CNGA3 with EMILIN1 c. Lane 5, same as lane 4, but with no beads. Lane 6, 200 ng purified CNGA3 plus GST lysate, i.e. negative control. Lane 7, 200 ng purified CNGA3 plus GST beads, negative control. (J) Western blot for EMILIN1 C-terminal segments detected with anti-GST. Lane 1, protein standards with molecular masses indicated to the left-hand side in kDa. Lane 2, 50 ng of purified EMILIN1 c. Lane 3, 50 ng of purified EMILIN1 a. Lane 4, 50 ng of purified EMILIN1 b. Lane 5, GST lysate (contains the GST vector).
Figure 7
Figure 7. Immunolocalization of EMILIN1 and PDE6C in rat organ of Corti
(A) EMILIN1 was immunolocalized with DAB to nerve fibres (efferents) crossing the tunnel of Corti ending at the base of outer hair cells (long arrows) in rat organ of Corti. Small nerve fibres at subcuticular plate sites of outer hair cells were immunoreactive (short arrows) and stereociliary arrays of both inner and outer hair cells exhibited immunoreactivity for EMILIN1 (asterisks). (B) With fluorescence detection, EMILIN1 immunoreactivity was again found in olivocochlear axonal efferent fibres crossing the tunnel (long arrow), making contact with the base of the outer hair cells and Deiters’ cells (short arrows). Immunoreactivity was clearly associated with stereocilia of both inner and outer hair cells (mid-length arrows). (C) PDE6C immunoreactivity was associated with Deiters’ cells; however, this was not due to overlapping efferent/afferent contacts, since neither the tunnel crossing efferents nor the type II afferents were immunoreactive. PDE6C immunoreactivity was found at subcuticular sites on outer hair cells (short arrows) and was strongly present on stereocilia of the inner hair cell (mid-length arrow). (D) PDE6C immunofluorescence was associated with stereocilia of both inner and outer hair cells (arrows).
Figure 8
Figure 8. PDE6C expression in the trout saccular hair cell preparation
OMIGA 2 alignment of PDE6C amino acid sequences. Line 1, human cone photoreceptor (hu cone) PDE6C (GenBank® accession number CAA64079). Line 2, zebrafish (zf) PDE6C (GenBank® accession number NP_957165). Line 3, trout saccular hair cell (thc) PDE6C deduced from RT–PCR. Line 4, zebrafish (zf) PDE5a (GenBank® accession number NP_001116732).

Similar articles

Cited by

References

    1. Zagotta WN and Siegelbaum SA (1996) Structure and function of cyclic nucleotide-gated channels. Annu. Rev. Neurosci 19, 235–263 - PubMed
    1. Biel M and Michalakis S (2009) Cyclic nucleotide-gated channels. Handb. Exp. Pharmacol 191, 111–136 - PubMed
    1. Misaka T, Kusakabe Y, Emori Y, Gonoi T, Arai S and Abe K (1997) Taste buds have a cyclic nucleotide-activated channel, CNGgust. J. Biol. Chem 272, 22623–22629 - PubMed
    1. Lee HM, Park YS, Kim W and Park CS (2001) Electrophysiological characteristics of rat gustatory cyclic nucleotide-gated channel expressed in Xenopus oocytes. J. Neurophysiol 85, 2335–2349 - PubMed
    1. Bradley J, Frings S, Yau KW and Reed R (2001) Nomenclature for ion channel subunits. Science 294, 2095–2096 - PMC - PubMed

Publication types

MeSH terms

Substances

Associated data