. 2012 Jan 16:12:8.
doi: 10.1186/1471-2229-12-8.

Defects in leaf carbohydrate metabolism compromise acclimation to high light and lead to a high chlorophyll fluorescence phenotype in Arabidopsis thaliana

Affiliations

Defects in leaf carbohydrate metabolism compromise acclimation to high light and lead to a high chlorophyll fluorescence phenotype in Arabidopsis thaliana

Jessica Schmitz et al. BMC Plant Biol. .

Abstract

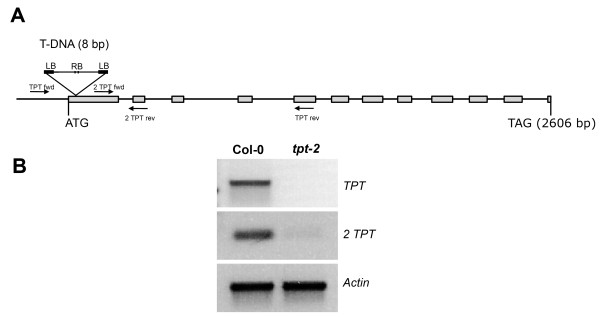
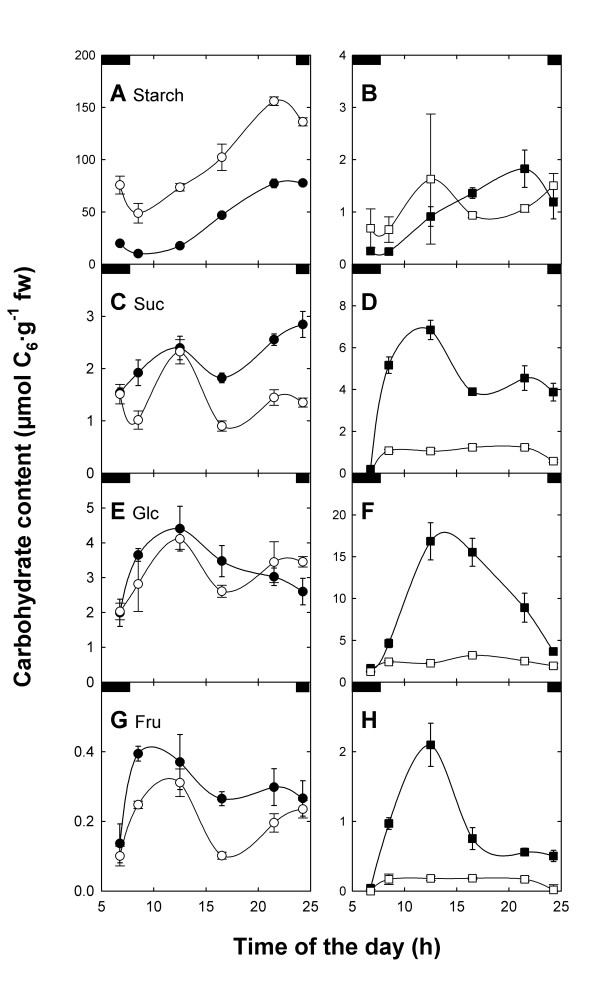
Background: We have studied the impact of carbohydrate-starvation on the acclimation response to high light using Arabidopsis thaliana double mutants strongly impaired in the day- and night path of photoassimilate export from the chloroplast. A complete knock-out mutant of the triose phosphate/phosphate translocator (TPT; tpt-2 mutant) was crossed to mutants defective in (i) starch biosynthesis (adg1-1, pgm1 and pgi1-1; knock-outs of ADP-glucose pyrophosphorylase, plastidial phosphoglucomutase and phosphoglucose isomerase) or (ii) starch mobilization (sex1-3, knock-out of glucan water dikinase) as well as in (iii) maltose export from the chloroplast (mex1-2).

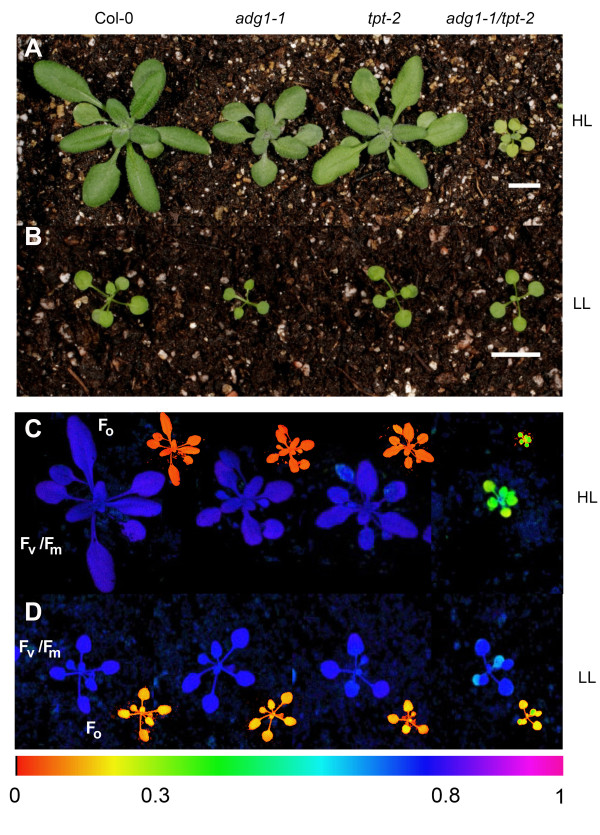
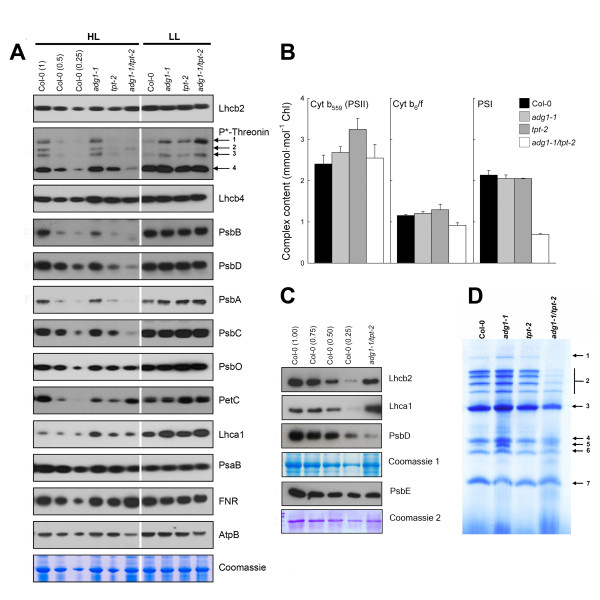
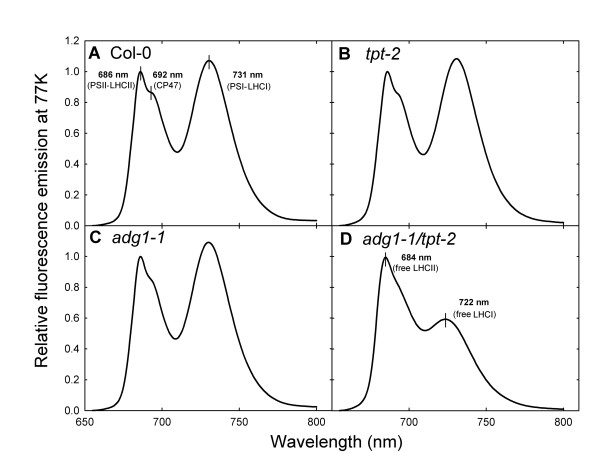
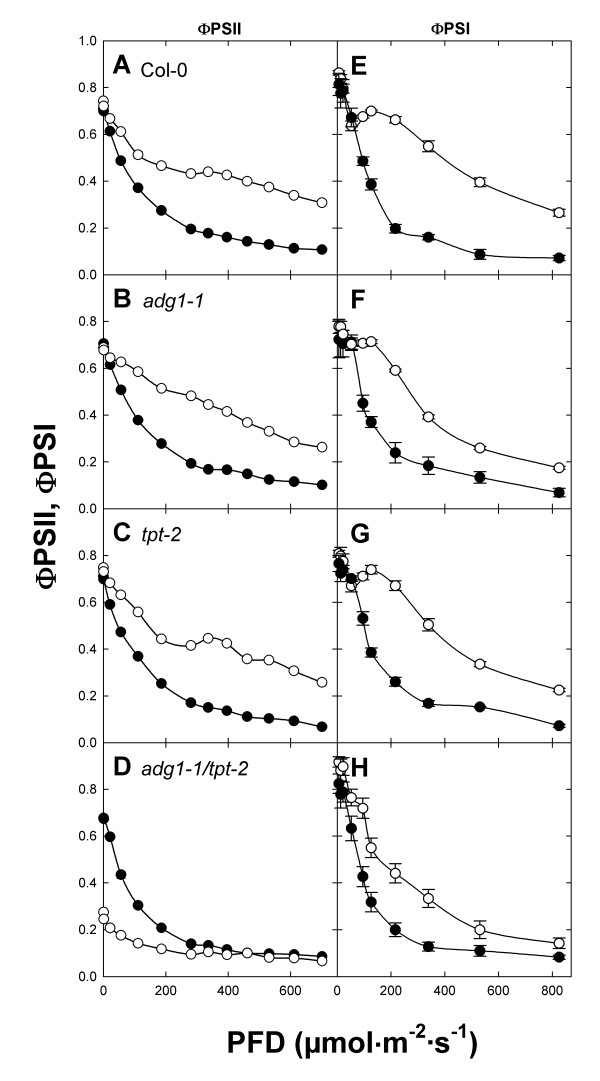
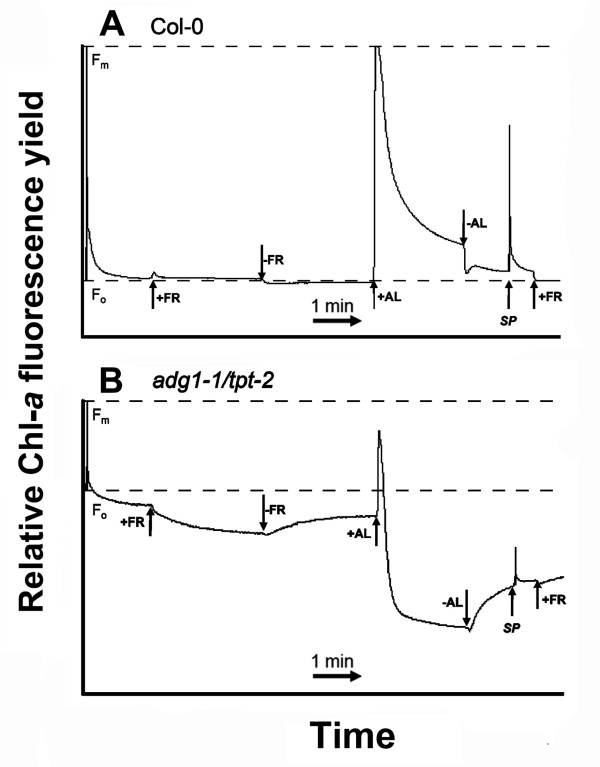
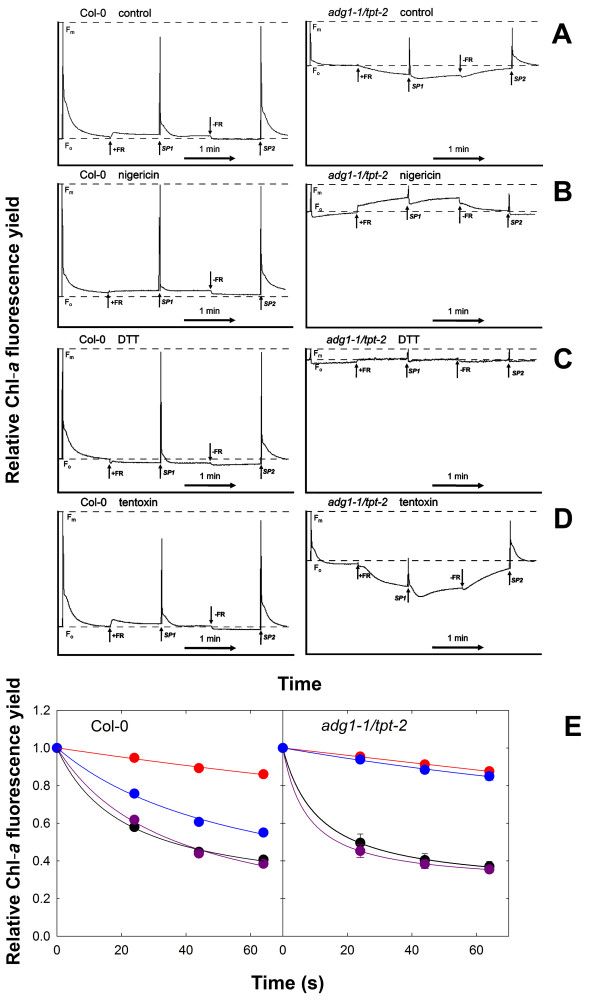
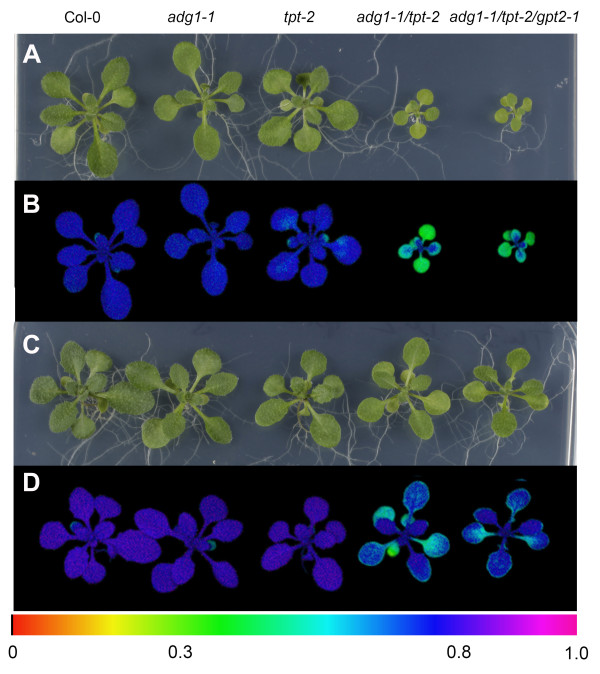
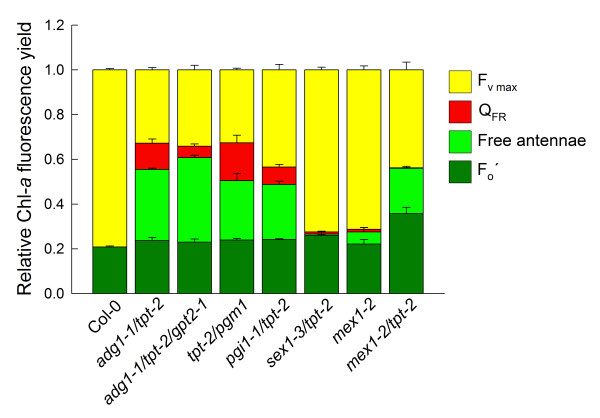
Results: All double mutants were viable and indistinguishable from the wild type when grown under low light conditions, but--except for sex1-3/tpt-2--developed a high chlorophyll fluorescence (HCF) phenotype and growth retardation when grown in high light. Immunoblots of thylakoid proteins, Blue-Native gel electrophoresis and chlorophyll fluorescence emission analyses at 77 Kelvin with the adg1-1/tpt-2 double mutant revealed that HCF was linked to a specific decrease in plastome-encoded core proteins of both photosystems (with the exception of the PSII component cytochrome b559), whereas nuclear-encoded antennae (LHCs) accumulated normally, but were predominantly not attached to their photosystems. Uncoupled antennae are the major cause for HCF of dark-adapted plants. Feeding of sucrose or glucose to high light-grown adg1-1/tpt-2 plants rescued the HCF- and growth phenotypes. Elevated sugar levels induce the expression of the glucose-6-phosphate/phosphate translocator2 (GPT2), which in principle could compensate for the deficiency in the TPT. A triple mutant with an additional defect in GPT2 (adg1-1/tpt-2/gpt2-1) exhibited an identical rescue of the HCF- and growth phenotype in response to sugar feeding as the adg1-1/tpt-2 double mutant, indicating that this rescue is independent from the sugar-triggered induction of GPT2.

Conclusions: We propose that cytosolic carbohydrate availability modulates acclimation to high light in A. thaliana. It is conceivable that the strong relationship between the chloroplast and nucleus with respect to a co-ordinated expression of photosynthesis genes is modified in carbohydrate-starved plants. Hence carbohydrates may be considered as a novel component involved in chloroplast-to-nucleus retrograde signaling, an aspect that will be addressed in future studies.


Figures

Figure 1
Figure 1
Molecular characterization of the tpt-2 T-DNA insertion mutant. (A) Position of the T-DNA insertion in the TPT gene as well as primers used for RT-PCR. (B) Transcript levels of the TPT as well as the actin control in wild-type and tpt-2 plants determined by RT-PCR using the primer pairs TPT fwd and TPT rev (TPT) or 2 TPT fwd and 2 TPT rev (2 TPT). The low amount of the amplified 2 TPT product is due to a second ATG 32 bp downstream of the start ATG. However, this ATG is not within the reading frame
Figure 2
Figure 2
Phenotypes and Chl-a fluorescence images of wild-type and mutant plants. Phenotypic appearance of Col-0, adg1-1, tpt-2 and adg1-1/tpt-2 grown in HL (A) or LL (B) for 4 weeks as well as Chl-a fluorescence false color images of the Fv/Fm ratio of the same lines grown in HL (C) or LL (D). The smaller insets in (C) and (D) show images of Fo. Care was taken that the distance between the leaf surface of the plants and the light source was constant in all experiments. The color scale indicates the numeric values of Fv/Fm ratios or of Fo (in a V-scale). The size bars in (A) and (B) indicate 1 cm
Figure 3
Figure 3
Structural analyses of leaf cross sections or chloroplast of LL- and HL-grown wild-type and adg1-1/tpt-2 plants. Leaf cross sections (A, B, E, F) and chloroplast ultrastructure (C, D, G-I) obtained by light microscopy or TEM of wild-type (A-D) or adg1-1/tpt-2 double mutant plants (E-J) grown in LL (A, C, E, G, I) or HL (B, D, F, H, J). The bars in (A, B, E, F) represent 100 μm
Figure 4
Figure 4
Immunoblots of thylakoid proteins, spectroscopic determinations of functional PS components, and separation of PS complexes by Blue-Native gel electrophoresis. (A) Immunoblots of thylakoid proteins associated with photosynthesis after separation of total proteins (approximately 10 μg per lane) isolated from leaves of HL- and LL- grown Col-0 wild type, the adg1-1 and tpt-2 single mutants as well as the adg1-1/tpt-2 double mutant on SDS-PAGE. Note that the Coomassie staining for proteins of HL-grown tpt-2 corresponds to about 0.5-fold rather than 1-fold of Col-0 protein. P*-Threonin indicates signals obtained following incubation of the blots with a phospho-threonin antibody. The numbers indicate signals from PsbC (1), CaS (2), PsbA/PsbD (3), and LhcbII (4). (B) Spectroscopic determinations of functional components of PSII, PSI and the cyt b6/f complex. (C) Immunoblots of PsbE in comparison to Lhcb2, Lhca1, and PsbE in HL-grown wild-type and adg1-1/tpt-2 plants. (D) Separation of thylakoid proteins of HL-grown Col-0 wild type, the adg1-1 and tpt-2 single mutants as well as the adg1-1/tpt-2 double mutant on Blue-Native gels. The numbers indicate individual protein fractions of the isolated thylakoids such as the NDH complex (1, see Additional file 2: Table S2), PSII super complexes (2), PSI supercomplex/PSII dimer (3), ATPase (4), PSII monomers (5), PSII/PsbC (6), and LHCII trimers (7)
Figure 5
Figure 5
Fluorescence emission spectra of Chl at 77 K. Relative fluorescence emission spectra of Chl in isolated thylakoids from Col-0 wild type (A), tpt-2 (B), adg1-1 (C), and adg1-1/tpt-2 (D) determined at 77 K. The spectra were normalized for the peak intensity at 686 nm in case of the wild type and the single mutants, and to the emission maximum of the free LHCII at 684 nm in case of the adg1-1/tpt-2 double mutant
Figure 6
Figure 6
Light dependencies of ΦPSII and ΦPSI of HL- and LL-grown wild-type and mutant plants. The response of the quantum efficiencies of PSII (ΦPSII, A-D) or PSI (ΦPSI, E-H) towards increasing light intensities was determined with a DUAL PAM fluorometer for Col-0 wild type (A, E), the adg1-1 (B, F) or tpt-2 (C, G) single mutants as well as the adg1-1/tpt-2 double mutant (D, H) grown in HL (○) or LL (●). The data represent the mean ± SE of 12 independent measurements. Note that for some data the error bars are smaller than the symbol size
Figure 7
Figure 7
Time course of Chl-a fluorescence yields of wild-type or double mutant plants in response to far red (FR) or actinic light (AL). The response of Chl-a fluorescence yields of Col-0 wild-type (A) or adg1-1/tpt-2 double mutant plants (B) towards FR or AL (at a PFD of 4000 μmol·m-2·s-1) was determined in time course experiments with a PAM 2100 fluorometer. The plants were dark-adapted for 30 min prior to the experiment. During the course of the experiment a saturation light pulse (SP) was applied after 5 s in order to determine Fo and Fm. Where indicated by arrows, FR or AL were either switched on (+) or off (-). SP indicates the application of saturation light pulses
Figure 8
Figure 8
Effects of nigericin, DTT and tentoxin on the response of Chl-a fluorescence to illumination with far red light in dark-adapted wild-type and double mutant plants. The time course experiments were conducted with a PAM 2100 fluorometer and show the response of Chl-a fluorescence yields of Col-0 wild-type or adg1-1/tpt-2 double mutant plants toward far red (FR) illumination in the absence (control, A) or presence of nigericin (B), DTT (C) or tentoxin (D). Prior to the measurements detached leaves were incubated either in 0.05% ethanol (control) or inhibitor solutions for 1 h in the dark. During the course of the experiment a saturation light pulse (SP) was applied after 5 s in order to determine Fo and Fm. Where indicated by arrows, FR was either switched on (+) or off (-). SP indicates the application of saturation light pulses. (E) Impact of nigericin (red circles), DTT (blue circles) or tentoxin (purple circles) on the decay of maximum Chl-a fluorescence yield (Fm') in leaves of Col-0 and adg1-1/tpt-2 plants during illumination with AL at a PDF of 600 μmol·m -2·s -1 compared to the control (black circles). The data for adg1-1/tpt-2 represent the mean ± SE of n = 3 independent experiment
Figure 9
Figure 9
Diurnal changes in carbohydrate contents in leaves of wild-type and mutant plants. Contents of starch (A, B), the soluble sugars sucrose (C, D), glucose (E, F) and fructose (G, H) in leaves of Col-0 wild-type (●), the tpt-2 (○) and adg1-1 single mutants (■) as well as the adg1-1/tpt-2 double mutant (□). The data represent the mean ± SE of three independent experiments. Note that the y-axes have been adapted to maximum carbohydrate contents in the individual lines
Figure 10
Figure 10
Phenotypes and Chl-a fluorescence images of wild-type and mutant plants grown on MS agar plates in the absence or presence of Suc. Phenotypic appearance of Col-0, adg1-1, tpt-2, adg1-1/tpt-2, and adg1-1/tpt-2/gpt2-1 grown under HL-conditions for 4 weeks on MS-agar plates in the absence (A) or presence (C) of 50 mM Suc as well as modulated Chl-a fluorescence false color images of the Fv/Fm ratio of the same lines in the absence (B) or presence (D) of Suc. The color scale indicates the numeric values of the Fv/Fm ratios
Figure 11
Figure 11
Summarizing analysis of Chl-a fluorescence yields of dark-adapted wild-type and mutant plants. The analysis is based on similar time course experiments as shown in Figure 7. The individual bars indicate fluorescence emitted from LCHs associated with PSII (dark green bars; Fo, i.e. after application of AL at a PFD of 4000 μmol·m-2·s-1), whereas (light green bars) and (red bars) indicate the relative fluorescence yield emitted from free antennae, which either can (light green bars) or cannot (red bars) be partially quenched by FR illumination (QFR). The yellow bars represent the maximum Fv emitted from PSII reaction centers. The data were normalized for Fm (= 1) and represent the mean ± SE of n = 3 measurements

Similar articles

Cited by

References

    1. Fliege R, Flügge UI, Werdan K, Heldt HW. Specific transport of inorganic phosphate, 3-phosphoglycerate and triosephosphates across the inner membrane of the envelope in spinach chloroplasts. Biochim Biophys Acta. 1978;502:232–247. doi: 10.1016/0005-2728(78)90045-2. - DOI - PubMed
    1. Weise SE, Weber AP, Sharkey TD. Maltose is the major form of carbon exported from the chloroplast at night. Planta. 2004;218:474–482. doi: 10.1007/s00425-003-1128-y. - DOI - PubMed
    1. Zeeman SC, Kossmann J, Smith AM. Starch: its metabolism, evolution, and biotechnological modification in plants. Annu Rev Plant Biol. 2010;61:209–234. doi: 10.1146/annurev-arplant-042809-112301. - DOI - PubMed
    1. Weber A, Servaites JC, Geiger DR, Kofler H, Hille D, Gröner F, Hebbeker U, Flügge UI. Identification, purification and molecular cloning of a putative plastidic glucose translocator. Plant Cell. 2000;12:787–801. - PMC - PubMed
    1. Niittylä T, Messerli G, Trevisan M, Chen J, Smith AM, Zeeman SC. A previously unknown maltose transporter essential for starch degradation in leaves. Science. 2004;303:87–89. doi: 10.1126/science.1091811. - DOI - PubMed

Publication types

MeSH terms

LinkOut - more resources