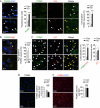
Loss of autophagy in hypothalamic POMC neurons impairs lipolysis
- PMID: 22249165
- PMCID: PMC3323137
- DOI: 10.1038/embor.2011.260
Loss of autophagy in hypothalamic POMC neurons impairs lipolysis
Abstract
Autophagy degrades cytoplasmic contents to achieve cellular homeostasis. We show that selective loss of autophagy in hypothalamic proopiomelanocortin (POMC) neurons decreases α-melanocyte-stimulating hormone (MSH) levels, promoting adiposity, impairing lipolysis and altering glucose homeostasis. Ageing reduces hypothalamic autophagy and α-MSH levels, and aged-mice phenocopy, the adiposity and lipolytic defect observed in POMC neuron autophagy-null mice. Intraperitoneal isoproterenol restores lipolysis in both models, demonstrating normal adipocyte catecholamine responsiveness. We propose that an unconventional, autophagosome-mediated form of secretion in POMC neurons controls energy balance by regulating α-MSH production. Modulating hypothalamic autophagy might have implications for preventing obesity and metabolic syndrome of ageing.
Conflict of interest statement
The authors declare that they have no conflict of interest.
Figures


Comment in
-
Autophagy--alias self-eating--appetite and ageing.EMBO Rep. 2012 Mar 1;13(3):173-4. doi: 10.1038/embor.2012.5. EMBO Rep. 2012. PMID: 22302030 Free PMC article. No abstract available.
Similar articles
-
Autophagy in hypothalamic AgRP neurons regulates food intake and energy balance.Cell Metab. 2011 Aug 3;14(2):173-83. doi: 10.1016/j.cmet.2011.06.008. Cell Metab. 2011. PMID: 21803288 Free PMC article.
-
SGK1/FOXO3 Signaling in Hypothalamic POMC Neurons Mediates Glucocorticoid-Increased Adiposity.Diabetes. 2018 Apr;67(4):569-580. doi: 10.2337/db17-1069. Epub 2018 Jan 10. Diabetes. 2018. PMID: 29321171
-
Amylin receptor insensitivity impairs hypothalamic POMC neuron differentiation in the male offspring of maternal high-fat diet-fed mice.Mol Metab. 2021 Feb;44:101135. doi: 10.1016/j.molmet.2020.101135. Epub 2020 Dec 3. Mol Metab. 2021. PMID: 33279727 Free PMC article.
-
Hypothalamic proopiomelanocortin processing and the regulation of energy balance.Eur J Pharmacol. 2011 Jun 11;660(1):213-9. doi: 10.1016/j.ejphar.2010.10.107. Epub 2011 Jan 3. Eur J Pharmacol. 2011. PMID: 21208604 Free PMC article. Review.
-
Pro-opiomelanocortin processing in the hypothalamus: impact on melanocortin signalling and obesity.J Endocrinol. 2002 Mar;172(3):411-21. doi: 10.1677/joe.0.1720411. J Endocrinol. 2002. PMID: 11874690 Review.
Cited by
-
Regulation and Functions of Autophagic Lipolysis.Trends Endocrinol Metab. 2016 Oct;27(10):696-705. doi: 10.1016/j.tem.2016.06.003. Epub 2016 Jun 27. Trends Endocrinol Metab. 2016. PMID: 27365163 Free PMC article. Review.
-
Autophagy in Myf5+ progenitors regulates energy and glucose homeostasis through control of brown fat and skeletal muscle development.EMBO Rep. 2013 Sep;14(9):795-803. doi: 10.1038/embor.2013.111. Epub 2013 Aug 2. EMBO Rep. 2013. PMID: 23907538 Free PMC article.
-
Black Pepper or Radish Seed Oils in a New Combination of Essential Oils Modulated Broiler Chickens' Performance and Expression of Digestive Enzymes, Lipogenesis, Immunity, and Autophagy-Related Genes.Vet Sci. 2022 Jan 24;9(2):43. doi: 10.3390/vetsci9020043. Vet Sci. 2022. PMID: 35202296 Free PMC article.
-
Autophagy activation contributes to lipid accumulation in tubular epithelial cells during kidney fibrosis.Cell Death Discov. 2018 Jun 27;4:2. doi: 10.1038/s41420-018-0065-2. eCollection 2018. Cell Death Discov. 2018. PMID: 30062051 Free PMC article.
-
Identification of autophagy as a longevity-assurance mechanism in the aging model Podospora anserina.Autophagy. 2014 May;10(5):822-34. doi: 10.4161/auto.28148. Epub 2014 Feb 27. Autophagy. 2014. PMID: 24584154 Free PMC article.
References
Publication types
MeSH terms
Substances
Grants and funding
- K01 DK087776/DK/NIDDK NIH HHS/United States
- DK033823/DK/NIDDK NIH HHS/United States
- DK087776/DK/NIDDK NIH HHS/United States
- R01 DK033823/DK/NIDDK NIH HHS/United States
- DK020541/DK/NIDDK NIH HHS/United States
- P30 DK020541/DK/NIDDK NIH HHS/United States
- T32AG023475/AG/NIA NIH HHS/United States
- T32 GM007288/GM/NIGMS NIH HHS/United States
- T32 AG023475/AG/NIA NIH HHS/United States
- R37 DK033823/DK/NIDDK NIH HHS/United States
- P30 DK026687/DK/NIDDK NIH HHS/United States
- P60 DK020541/DK/NIDDK NIH HHS/United States
LinkOut - more resources
Full Text Sources
Other Literature Sources
Molecular Biology Databases
Miscellaneous

