

Gα12 activation in podocytes leads to cumulative changes in glomerular collagen expression, proteinuria and glomerulosclerosis
- PMID: 22249312
- PMCID: PMC3338890
- DOI: 10.1038/labinvest.2011.198
Gα12 activation in podocytes leads to cumulative changes in glomerular collagen expression, proteinuria and glomerulosclerosis
Abstract
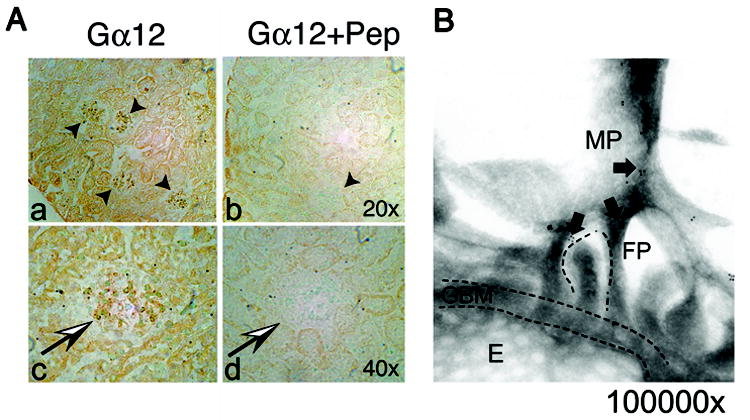
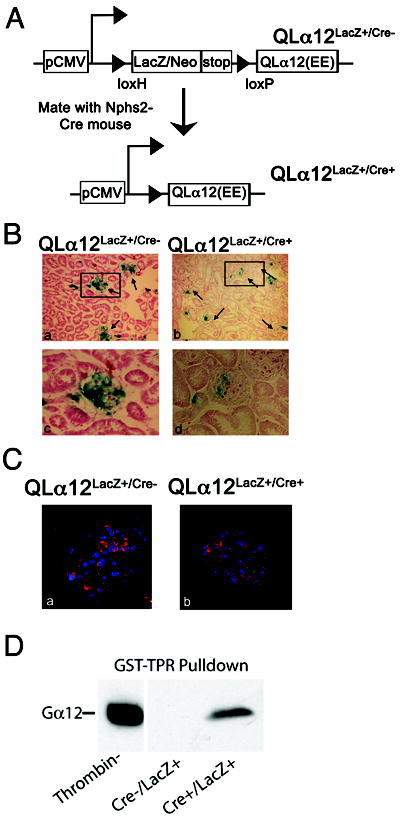
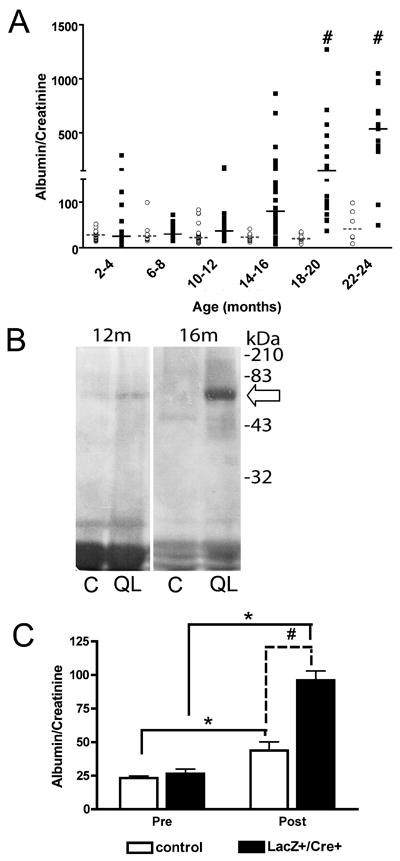
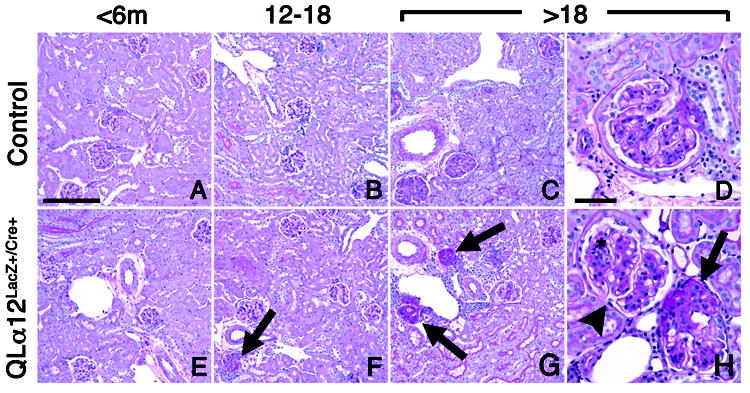
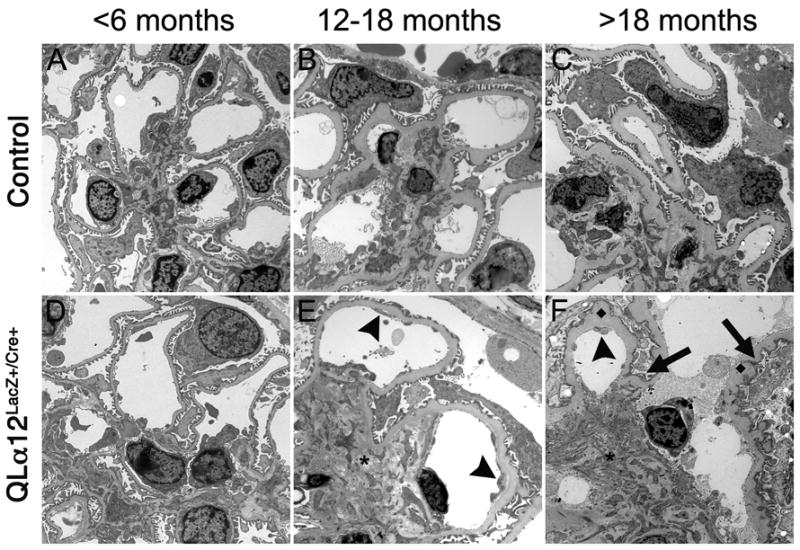
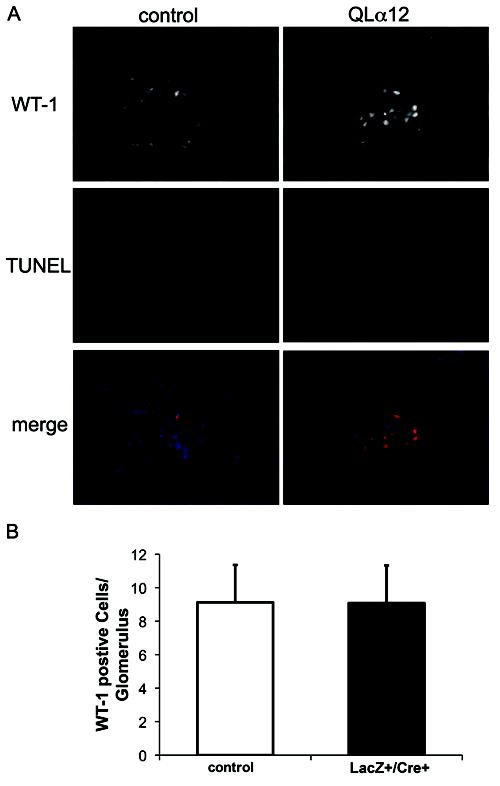
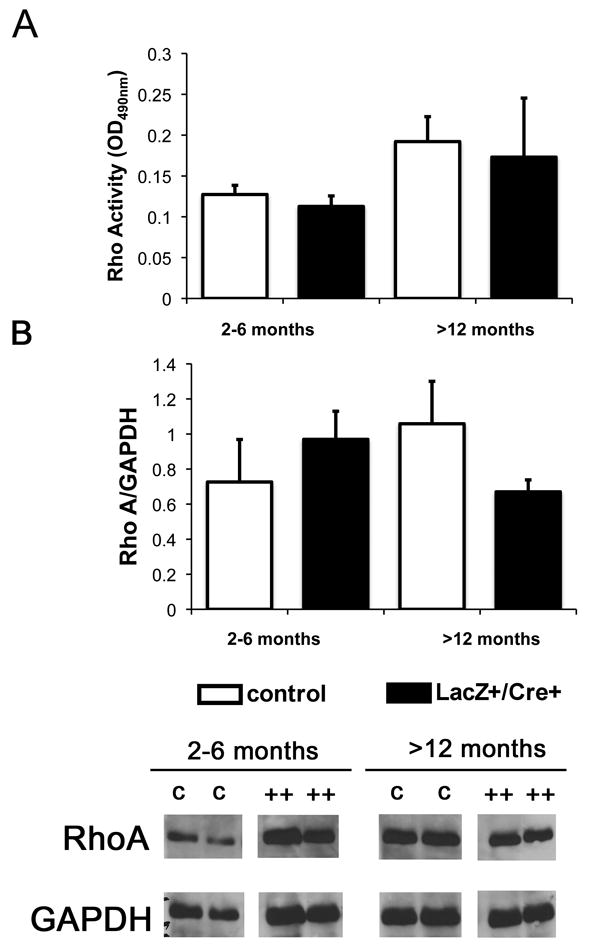
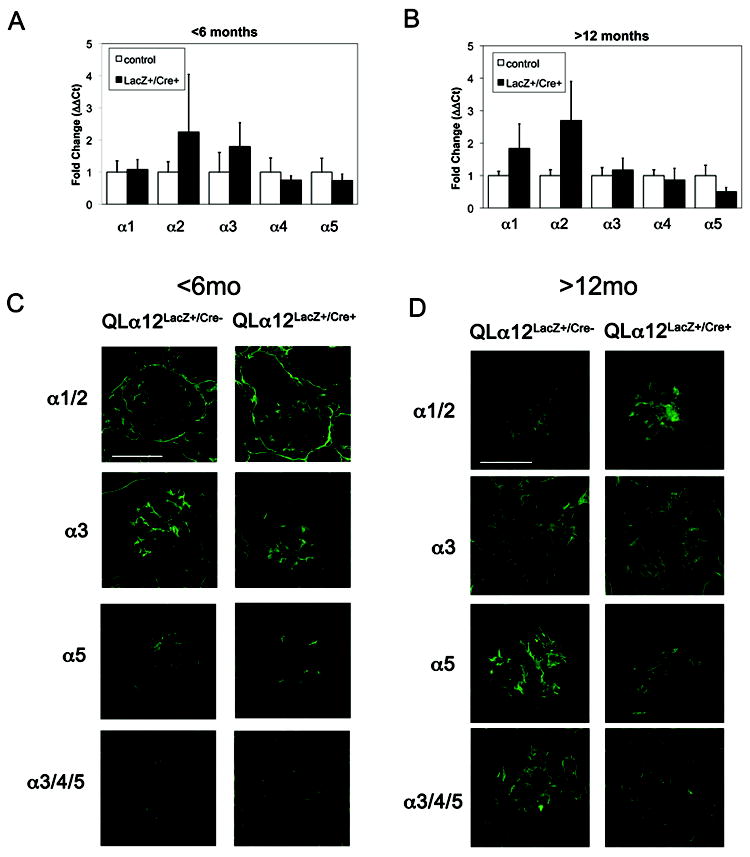
Glomerulosclerosis is a common pathological finding that often progresses to renal failure. The mechanisms of chronic kidney disease progression are not well defined, but may include activation of numerous vasoactive and inflammatory pathways. We hypothesized that podocytes are susceptible to filtered plasma components, including hormones and growth factors that stimulate signaling pathways leading to glomerulosclerosis. Gα12 couples to numerous G-protein-coupled receptors (GPCRs) and regulates multiple epithelial responses, including proliferation, apoptosis, permeability and the actin cytoskeleton. Herein, we report that genetic activation of Gα12 in podocytes leads to time-dependent increases in proteinuria and glomerulosclerosis. To mimic activation of Gα12 pathways, constitutively active Gα12 (QL) was conditionally expressed in podocytes using Nphs2-Cre and LacZ/floxed QLα12 transgenic mice. Some QLα12(LacZ+/Cre+) mice developed proteinuria at 4-6 months, and most were proteinuric by 12 months. Proteinuria increased with age, and by 12-14 months, many demonstrated glomerulosclerosis with ultrastructural changes, including foot process fusion and both mesangial and subendothelial deposits. QLα12(LacZ+/Cre+) mice showed no changes in podocyte number, apoptosis, proliferation or Rho/Src activation. Real-time PCR revealed no significant changes in Nphs1, Nphs2, Cd2ap or Trpc6 expression, but Col4a2 message was increased in younger and older mice, while Col4a5 was decreased in older mice. Confocal microscopy revealed disordered collagen IVα1/2 staining in older mice and loss of α5 without changes in other collagen IV subunits. Taken together, these studies suggest that Gα12 activation promotes glomerular injury without podocyte depletion through a novel mechanism regulating collagen (α)IV expression, and supports the notion that glomerular damage may accrue through persistent GPCR activation in podocytes.
Conflict of interest statement
Conflict of Interest: None
Figures
Similar articles
-
Transient receptor potential channel 6 (TRPC6) protects podocytes during complement-mediated glomerular disease.J Biol Chem. 2013 Dec 20;288(51):36598-609. doi: 10.1074/jbc.M113.488122. Epub 2013 Nov 5. J Biol Chem. 2013. PMID: 24194522 Free PMC article.
-
Fn14 in podocytes and proteinuric kidney disease.Biochim Biophys Acta. 2013 Dec;1832(12):2232-43. doi: 10.1016/j.bbadis.2013.08.010. Epub 2013 Aug 30. Biochim Biophys Acta. 2013. PMID: 23999007
-
Aberrant Notch1-dependent effects on glomerular parietal epithelial cells promotes collapsing focal segmental glomerulosclerosis with progressive podocyte loss.Kidney Int. 2013 Jun;83(6):1065-75. doi: 10.1038/ki.2013.48. Epub 2013 Feb 27. Kidney Int. 2013. PMID: 23447065 Free PMC article.
-
Regulation of TRPC6 ion channels in podocytes - Implications for focal segmental glomerulosclerosis and acquired forms of proteinuric diseases.Acta Physiol Hung. 2015 Sep;102(3):241-51. doi: 10.1556/036.102.2015.3.2. Acta Physiol Hung. 2015. PMID: 26551740 Review.
-
Detrimental effects of hypoxia on glomerular podocytes.J Physiol Biochem. 2021 May;77(2):193-203. doi: 10.1007/s13105-021-00788-y. Epub 2021 Apr 9. J Physiol Biochem. 2021. PMID: 33835424 Review.
Cited by
-
Accessory proteins for heterotrimeric G-proteins in the kidney.Front Physiol. 2015 Aug 7;6:219. doi: 10.3389/fphys.2015.00219. eCollection 2015. Front Physiol. 2015. PMID: 26300785 Free PMC article. Review.
-
The inhibitory effect of angiotensin II on BKCa channels in podocytes via oxidative stress.Mol Cell Biochem. 2015 Jan;398(1-2):217-22. doi: 10.1007/s11010-014-2221-1. Epub 2014 Sep 19. Mol Cell Biochem. 2015. PMID: 25234195
-
H2O2 activates G protein, α 12 to disrupt the junctional complex and enhance ischemia reperfusion injury.Proc Natl Acad Sci U S A. 2012 Apr 24;109(17):6680-5. doi: 10.1073/pnas.1116800109. Epub 2012 Apr 9. Proc Natl Acad Sci U S A. 2012. PMID: 22493269 Free PMC article.
-
Gα12 and Gα13: Versatility in Physiology and Pathology.Front Cell Dev Biol. 2022 Feb 14;10:809425. doi: 10.3389/fcell.2022.809425. eCollection 2022. Front Cell Dev Biol. 2022. PMID: 35237598 Free PMC article. Review.
-
Stimulation of Dopamine D3 Receptor Attenuates Renal Ischemia-Reperfusion Injury via Increased Linkage With Gα12.Transplantation. 2015 Nov;99(11):2274-84. doi: 10.1097/TP.0000000000000762. Transplantation. 2015. PMID: 25989500 Free PMC article.
References
-
- U S Renal Data System. USRDS 2010 Annual Data Report: Atlas of Chronic Kidney Disease and End-Stage Renal Disease in the United States. National Institutes of Health, National Institute of Diabetes and Digestive and Kidney Diseases; Bethesda, MD: 2010.
-
- Zhou XJ, Rakheja D, Yu X, et al. The aging kidney. Kidney Int. 2008;74(6):710–20. - PubMed
-
- Schmitt R, Cantley LG. The impact of aging on kidney repair. Am J Physiol Renal Physiol. 2008 Jun 1;294(6):F1265–F72. - PubMed
-
- Wharram BL, Goyal M, Wiggins JE, et al. Podocyte depletion causes glomerulosclerosis: diphtheria toxin-induced podocyte depletion in rats expressing human diphtheria toxin receptor transgene. J Am Soc Nephrol. 2005 Oct 1;16(10):2941–52. - PubMed
-
- Matsusaka T, Xin J, Niwa S, et al. Genetic engineering of glomerular sclerosis in the mouse via control of onset and severity of podocyte-specific injury. J Am Soc Nephrol. 2005 Apr 1;16(4):1013–23. - PubMed
Publication types
MeSH terms
Substances
Grants and funding
LinkOut - more resources
Full Text Sources
Molecular Biology Databases
Miscellaneous
