. 2012 Feb 13;209(2):319-34.
doi: 10.1084/jem.20111566. Epub 2012 Jan 16.

TNF-induced osteoclastogenesis and inflammatory bone resorption are inhibited by transcription factor RBP-J

Affiliations

TNF-induced osteoclastogenesis and inflammatory bone resorption are inhibited by transcription factor RBP-J

Baohong Zhao et al. J Exp Med. .

Abstract

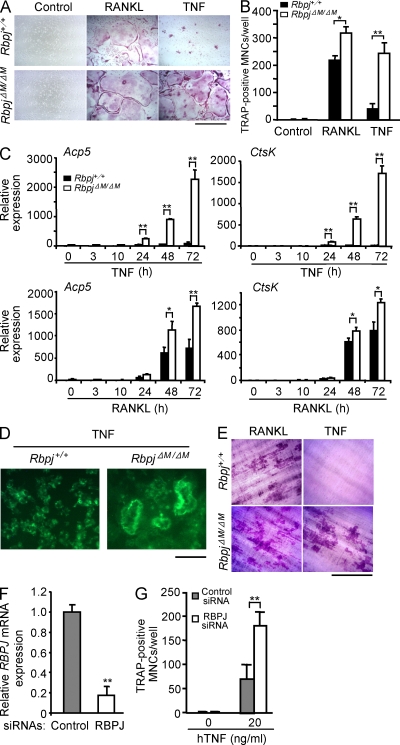
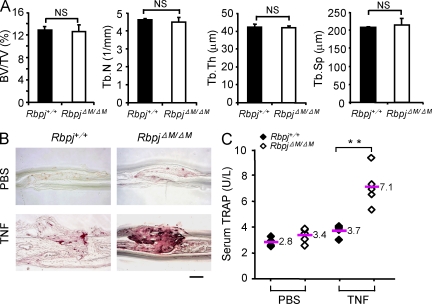
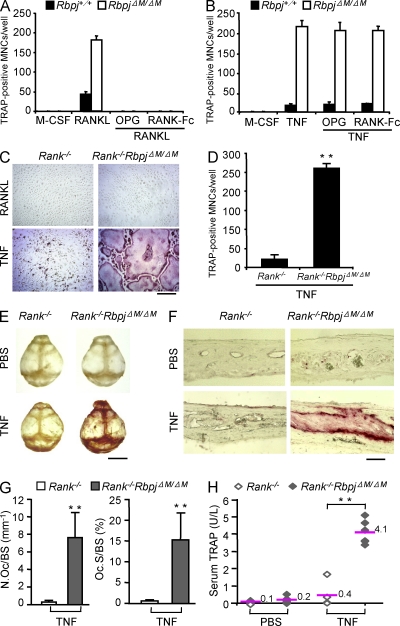
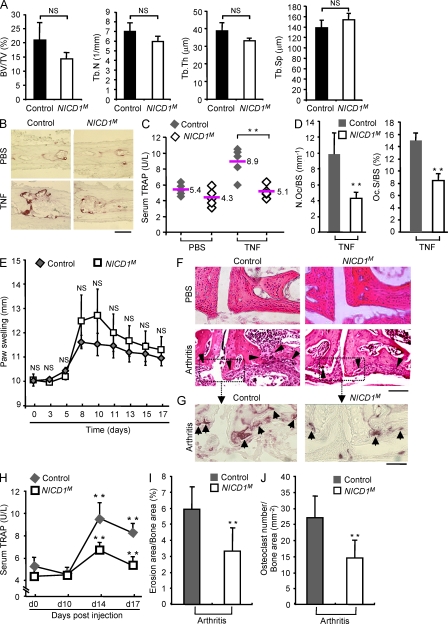
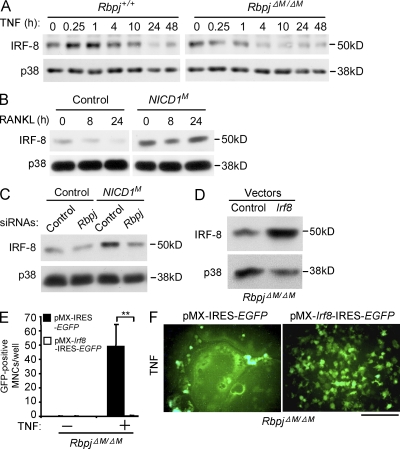
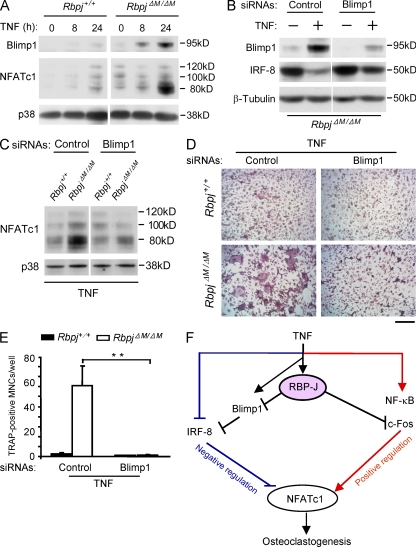
Tumor necrosis factor (TNF) plays a key role in the pathogenesis of inflammatory bone resorption and associated morbidity in diseases such as rheumatoid arthritis and periodontitis. Mechanisms that regulate the direct osteoclastogenic properties of TNF to limit pathological bone resorption in inflammatory settings are mostly unknown. Here, we show that the transcription factor recombinant recognition sequence binding protein at the J(κ) site (RBP-J) strongly suppresses TNF-induced osteoclastogenesis and inflammatory bone resorption, but has minimal effects on physiological bone remodeling. Myeloid-specific deletion of RBP-J converted TNF into a potent osteoclastogenic factor that could function independently of receptor activator of NF-κB (RANK) signaling. In the absence of RBP-J, TNF effectively induced osteoclastogenesis and bone resorption in RANK-deficient mice. Activation of RBP-J selectively in osteoclast precursors suppressed inflammatory osteoclastogenesis and arthritic bone resorption. Mechanistically, RBP-J suppressed induction of the master regulator of osteoclastogenesis (nuclear factor of activated T cells, cytoplasmic 1) by attenuating c-Fos activation and suppressing induction of B lymphocyte-induced maturation protein-1, thereby preventing the down-regulation of transcriptional repressors such as IRF-8 that block osteoclast differentiation. Thus, RBP-J regulates the balance between activating and repressive signals that regulate osteoclastogenesis. These findings identify RBP-J as a key upstream negative regulator of osteoclastogenesis that restrains excessive bone resorption in inflammatory settings.


Figures

Figure 1.
Figure 1.
TNF-induced osteoclastogenesis is restrained by RBP-J. BMMs derived from Rbpj+/+ and RbpjΔM/ΔM littermates were stimulated with RANKL or TNF in the presence of M-CSF. After 4 d, TRAP staining was performed (A), and the number of TRAP-positive MNCs per well was counted (B). TRAP-positive cells appear red in the photographs. Bar, 200 µm. *, P < 0.05; **, P < 0.01. (C) Quantitative real-time PCR analysis of mRNA expression of Acp5 (encoding TRAP) and Ctsk (encoding cathepsin K) in BMMs from Rbpj+/+ and RbpjΔM/ΔM littermates treated with TNF or RANKL in the presence of M-CSF for the indicated times. *, P < 0.05; **, P < 0.01. (D) Fluorescent images of actin ring staining from cell cultures of BMMs from Rbpj+/+ and RbpjΔM/ΔM littermates treated with TNF in the presence of M-CSF on dentin slices for 4 d. Bar, 100 µm. (E) Toluidine blue–stained dentin resorption pits formed by the osteoclasts derived from Rbpj+/+ and RbpjΔM/ΔM BMMs treated with RANKL or TNF in the presence of M-CSF for 7 d. Bar, 200 µm. (F) Quantitative real-time PCR analysis of RBPJ mRNA in human CD14-positive monocytes transfected with human RBPJ-specific siRNAs (RBPJ) or nontargeting control siRNAs (Control), and cultured for 2 d in the presence of M-CSF. **, P < 0.01. (G) Osteoclastogenesis of human osteoclast precursors transfected with RBP-J siRNAs or nontargeting control siRNAs in the presence of TNF with M-CSF for 6 d. The number of TRAP-positive MNCs per well was counted. **, P < 0.01. Data are representative of at least 20 independent experiments (A and B), or at least 3 independent experiments in (C–G).
Figure 2.
Figure 2.
Increased TNF-induced osteoclastogenesis and bone resorption in vivo in mice with myeloid-specific RBP-J deficiency. (A) μCT analysis of the femurs of 8-wk-old male Rbpj+/+ or RbpjΔM/ΔM littermates was performed. BV/TV, trabecular bone volume/tissue volume; Tb.N, trabecular number; Tb.Th, trabecular bone thickness; Tb.Sp, trabecular separation. n = 5 in each group. NS, no statistically significant difference. (B) TRAP staining of histological sections and (C) the concentration of serum TRAP obtained from Rbpj+/+ and RbpjΔM/ΔM littermates (8-wk-old) with or without TNF administration (75 µg/kg body weight). Bar, 200 µm in B. n = 5 per group. **, P < 0.01. Data are representative of two independent experiments (A–C).
Figure 3.
Figure 3.
RBP-J deficiency allows TNF to induce osteoclastogenesis and bone resorption independent of RANK signaling. (A) Quantitation of TRAP-positive MNCs of the cell cultures from Rbpj+/+ and RbpjΔM/ΔM BMMs treated with RANKL, RANKL together with OPG (100 ng/ml), or RANK-Fc (5 µg/ml) in the presence of M-CSF for 4 d. (B) Quantitation of TRAP-positive MNCs of the cell cultures from Rbpj+/+ and RbpjΔM/ΔM BMMs treated with TNF, TNF together with OPG (100 ng/ml), or RANK-Fc (5 µg/ml) in the presence of M-CSF for 4 d. TRAP staining (C) and quantitation (D) of TRAP-positive MNCs in 5-d osteoclastogenic cell cultures from Rank−/− and Rank−/−RbpjΔM/ΔM BMMs. Bar, 100 µm. **, P < 0.01. (E and F) TRAP staining of mouse whole calvaria (E) and of calvarial histological sections (F) obtained from 4-wk-old Rank−/− and Rank−/−RbpjΔM/ΔM mice injected with PBS or TNF (150 µg/kg body weight). n = 5 per group. Bars: 0.5 cm (E); 100 µm (F). (G) Histomorphometric analysis of calvaria from Rank−/− and Rank−/−RbpjΔM/ΔM mice. N.Oc/BS, number of osteoclasts per bone surface; Oc.S/BS, osteoclast surface per bone surface. n = 5 per group. **, P < 0.01. (H) The concentration of serum TRAP obtained from 4-wk-old Rank−/− and Rank−/−RbpjΔM/ΔM mice injected with PBS or TNF. n = 5 for Rank−/− mice, and n = 6 for Rank−/−RbpjΔM/ΔM mice. **, P < 0.01. Data are representative of at least three (A–D) or two (E–H) independent experiments.
Figure 4.
Figure 4.
Constitutive activation of RBP-J signaling in myeloid osteoclast precursor compartment in mice suppresses inflammatory bone resorption. (A) μCT analysis of the femurs of 8-wk-old male control or NICD1M mice was performed. BV/TV, trabecular bone volume/tissue volume; Tb.N, trabecular number; Tb.Th, trabecular bone thickness; Tb.Sp, trabecular separation. n = 5 in each group. NS, no statistically significant difference. (B) TRAP staining of histological sections and (C) the concentration of serum TRAP obtained from 6-wk-old NICD1M and control mice with or without supracalvarial TNF administration (100 µg/kg body weight). Bar, 50 µm. n = 5 per group. **, P < 0.01. (D) Histomorphometric analysis of calvaria from 6-wk-old NICD1M and control mice. N.Oc/BS, number of osteoclasts per bone surface; Oc.S/BS, osteoclast surface per bone surface. n = 5 per group. **, P < 0.01. (E) Paw swelling in arthritis induced in the 6-wk-old control and NICDM mice using anticollagen antibodies as described in Materials and methods. For each mouse, paw swelling was calculated as the sum of measurements of joint thickness of two wrists and two ankles. Paw swelling is represented as the mean ± SD for each group. n = 5 per group. NS, no statistically significant difference. (F) H&E staining of tissue sections of tarsal joints in 6-wk-old control and NICD1M mice treated with PBS or arthritis-inducing monoclonal antibody cocktail (arthritis) as described in Materials and methods. Black arrowheads indicate bone erosions. Bar, 100 µm. (G) TRAP staining of the tissue sections from the same area labeled with a dotted box in F. Black arrows show the osteoclasts (red spots) in the resorptive area. Bar, 50 µm. (H) Serum TRAP levels obtained from control and NICD1M mice at indicated times before and after induction of arthritis. n = 5 per group. **, P < 0.01. (I and J) Quantitative histomorphometric analysis of bone erosion (I) and osteoclast numbers (J) in tarsal joints. n = 5 per group. **, P < 0.01. Data are representative of two independent experiments (A–J).
Figure 5.
Figure 5.
RBP-J deficiency results in increased TNF-induced NFATc1 expression and function. (A) Quantitative real-time PCR analysis of mRNA expression of Nfatc1 in osteoclastogenic cell cultures from Rbpj+/+ and RbpjΔM/ΔM BMMs treated with TNF for the indicated times. *, P < 0.05; **, P < 0.01. (B) Immunoblot analysis of NFATc1 expression in whole-cell lysates obtained from Rbpj+/+ and RbpjΔM/ΔM BMMs at the indicated time points after stimulation with TNF. p38 was measured as a loading control. (C) Quantitative real-time PCR analysis of mRNA expression of Itgb3 (encoding integrin β3) in osteoclastogenic cell cultures from Rbpj+/+ and RbpjΔM/ΔM BMMs treated with TNF for the indicated times. **, P < 0.01. (D) ChIP analysis of NFATc1 occupancy at the promoter of Nfatc1 in the Rbpj+/+ and RbpjΔM/ΔM BMMs treated without or with TNF for 48 h. **, P < 0.01. (E) Quantitative real-time PCR analysis of expression of primary transcripts of Nfatc1 in osteoclastogenic cell cultures from Rbpj+/+ and RbpjΔM/ΔM BMMs treated with TNF. **, P < 0.01. (F) ChIP analysis of polymerase II occupancy at the Nfatc1 locus in Rbpj+/+ and RbpjΔM/ΔM BMMs treated without or with TNF for 24 h. Data are representative of at least three independent experiments (A–F). **, P < 0.01.
Figure 6.
Figure 6.
Constitutive activation of RBP-J signaling in myeloid osteoclast precursors suppresses NFATc1 expression and osteoclastogenesis. (A) Immunoblot analysis of NFATc1 in control and NICD1M BMMs treated with RANKL for the indicated times. p38 was measured as a loading control. (B) Quantitation of TRAP-positive MNCs in cell cultures from control and NICD1M BMMs treated with RANKL in the presence of M-CSF for 3 d. *, P < 0.05. (C) Quantitative real-time PCR analysis of Rbpj mRNA in control and NICD1M BMMs transfected with siRNA targeting Rbpj or nontargeting control siRNAs (Control) for 24 h. **, P < 0.01. (D) Immunoblot analysis of NFATc1 in control and NICD1M BMMs transfected with Rbpj or control siRNAs and stimulated with RANKL for 24 h. p38 was measured as a loading control. (E) Quantitation of TRAP-positive MNCs in cell cultures from control and NICD1M BMMs transfected with Rbpj or control siRNAs and stimulated with RANKL for 3 d. *, P < 0.05; NS, no statistically significant difference. Data are representative of at least three independent experiments (A–E).
Figure 7.
Figure 7.
RBP-J inhibits TNF-induced c-Fos expression and function. (A) Immunoblot analysis of c-Fos and c-Jun in nuclear and cytoplasmic fractions of Rbpj+/+ and RbpjΔM/ΔM BMMs obtained at the indicated time points after stimulation with TNF. TBP and p38 were measured as loading controls for nuclear and cytoplasmic fractions, respectively. (B) ChIP analysis of c-Fos occupancy at Nfatc1 promoter in Rbpj+/+ and RbpjΔM/ΔM BMMs treated without or with TNF for 40 h. **, P < 0.01. (C) Immunoblot analysis of c-Fos in Rbpj+/+ and RbpjΔM/ΔM BMMs transfected with Fos-specific short interfering RNAs (Fos) or nontargeting control siRNAs (Control), and treated with TNF for 16 h. (D and E) Osteoclastogenesis assays of Rbpj+/+ and RbpjΔM/ΔM BMMs transfected with siRNA targeting Fos mRNA or nontargeting control siRNAs (Control) in the presence of TNF. TRAP staining is shown in D and quantitated in E. Bar, 50 µm. **, P < 0.01. Data are representative of at least three independent experiments (A–E).
Figure 8.
Figure 8.
RBP-J maintains expression of IRF-8, which suppresses osteoclastogenesis. (A) Immunoblot analysis of IRF-8 expression in Rbpj+/+ and RbpjΔM/ΔM BMMs obtained at the indicated time points after stimulation with TNF. p38 was measured as a loading control. (B) Immunoblot analysis of IRF-8 in control and NICDM BMMs stimulated with RANKL for the indicated times. (C) Immunoblot analysis of IRF-8 in control and NICD1M BMMs transfected with Rbpj or control siRNAs. p38 was measured as a loading control. (D) Immunoblot analysis of IRF-8 in RbpjΔM/ΔM BMMs transduced with the retroviral vectors pMX-IRES-EGFP (Control) or pMX-Irf8-IRES-EGFP (Irf8). p38 was measured as a loading control. (E) Osteoclastogenesis assays using RbpjΔM/ΔM BMMs transduced with the retroviral vectors pMX-IRES-EGFP or pMX-Irf8-IRES-EGFP without or with TNF stimulation. The number of GFP-positive MNCs (osteoclasts) per well was counted. **, P < 0.01. (F) Fluorescent images of the RbpjΔM/ΔM BMMs transduced with the retroviral vectors pMX-IRES-EGFP or pMX-Irf8-IRES-EGFP with TNF stimulation. The GFP-positive multinucleate cells (osteoclasts) appear as large green cells. Bar, 100 µm. Data are representative of at least three independent experiments (A–F).
Figure 9.
Figure 9.
RBP-J prevents IRF-8 down-regulation by blocking TNF-induced Blimp1 expression. (A) Immunoblot analysis of the expression of Blimp1 and NFATc1 in Rbpj+/+ and RbpjΔM/ΔM BMMs obtained at the indicated time points after stimulation with TNF. p38 was measured as a loading control. (B) RbpjΔM/ΔM BMMs were transfected with Blimp1-specific siRNAs or nontargeting control siRNAs (Control), and treated without or with TNF for 24 h. Blimp1 and IRF-8 expression was assessed by immunoblot. β-Tubulin was measured as a loading control. (C) Rbpj+/+ and RbpjΔM/ΔM BMMs were transfected with Blimp1-specific siRNAs or nontargeting control siRNAs (Control), and treated with TNF for 24 h. NFATc1 expression was assessed by immunoblot. p38 was measured as a loading control. (D and E) Osteoclastogenesis assays of Rbpj+/+ and RbpjΔM/ΔM BMMs transfected with siRNA targeting Blimp1 mRNA or nontargeting control siRNAs (Control) in the presence of TNF for 4 d. TRAP staining is shown in D and quantitated in E. Bar, 50 µm. **, P < 0.01. (F) Model for the regulation of TNF-induced osteoclastogenesis by RBP-J. RBP-J functions as a central upstream regulator of the balance between activating and inhibitory pathways by suppressing c-Fos expression and preventing Blimp1-mediated down-regulation of IRF-8. Data are representative of at least three independent experiments (A–E).

Comment in

  • Bone: RBP-J prevents bone erosion.
    Smith K. Smith K. Nat Rev Rheumatol. 2012 Feb 7;8(3):123. doi: 10.1038/nrrheum.2012.12. Nat Rev Rheumatol. 2012. PMID: 22310186 No abstract available.

Similar articles

Cited by

References

    1. Androutsellis-Theotokis A., Leker R.R., Soldner F., Hoeppner D.J., Ravin R., Poser S.W., Rueger M.A., Bae S.K., Kittappa R., McKay R.D. 2006. Notch signalling regulates stem cell numbers in vitro and in vivo. Nature. 442:823–826 10.1038/nature04940 - DOI - PubMed
    1. Azuma Y., Kaji K., Katogi R., Takeshita S., Kudo A. 2000. Tumor necrosis factor-alpha induces differentiation of and bone resorption by osteoclasts. J. Biol. Chem. 275:4858–4864 10.1074/jbc.275.7.4858 - DOI - PubMed
    1. Bai S., Kopan R., Zou W., Hilton M.J., Ong C.T., Long F., Ross F.P., Teitelbaum S.L. 2008. NOTCH1 regulates osteoclastogenesis directly in osteoclast precursors and indirectly via osteoblast lineage cells. J. Biol. Chem. 283:6509–6518 10.1074/jbc.M707000200 - DOI - PubMed
    1. Beres T.M., Masui T., Swift G.H., Shi L., Henke R.M., MacDonald R.J. 2006. PTF1 is an organ-specific and Notch-independent basic helix-loop-helix complex containing the mammalian Suppressor of Hairless (RBP-J) or its paralogue, RBP-L. Mol. Cell. Biol. 26:117–130 10.1128/MCB.26.1.117-130.2006 - DOI - PMC - PubMed
    1. Boyce B.F., Schwarz E.M., Xing L. 2006. Osteoclast precursors: cytokine-stimulated immunomodulators of inflammatory bone disease. Curr. Opin. Rheumatol. 18:427–432 10.1097/01.bor.0000231913.32364.32 - DOI - PubMed

MeSH terms

Substances