. 2012 Feb 13;209(2):365-77.
doi: 10.1084/jem.20111980. Epub 2012 Jan 16.

Age, microbiota, and T cells shape diverse individual IgA repertoires in the intestine

Affiliations

Age, microbiota, and T cells shape diverse individual IgA repertoires in the intestine

Cornelia Lindner et al. J Exp Med. .

Abstract

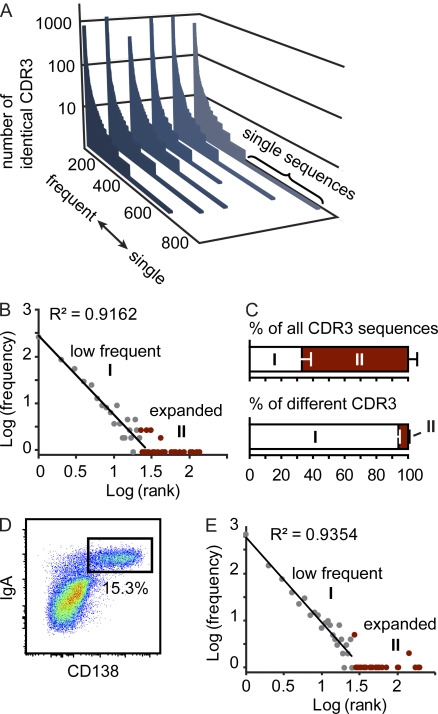
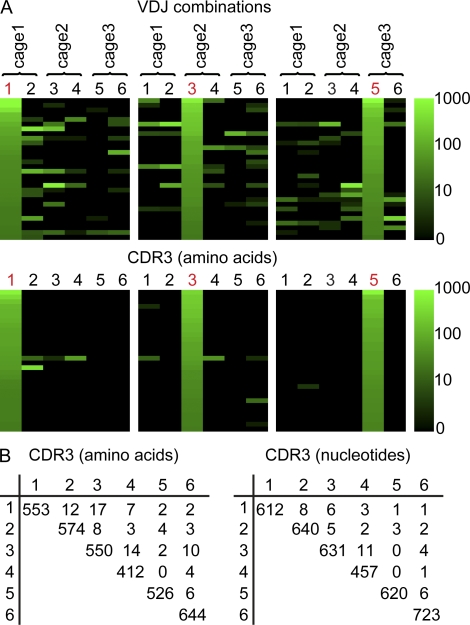
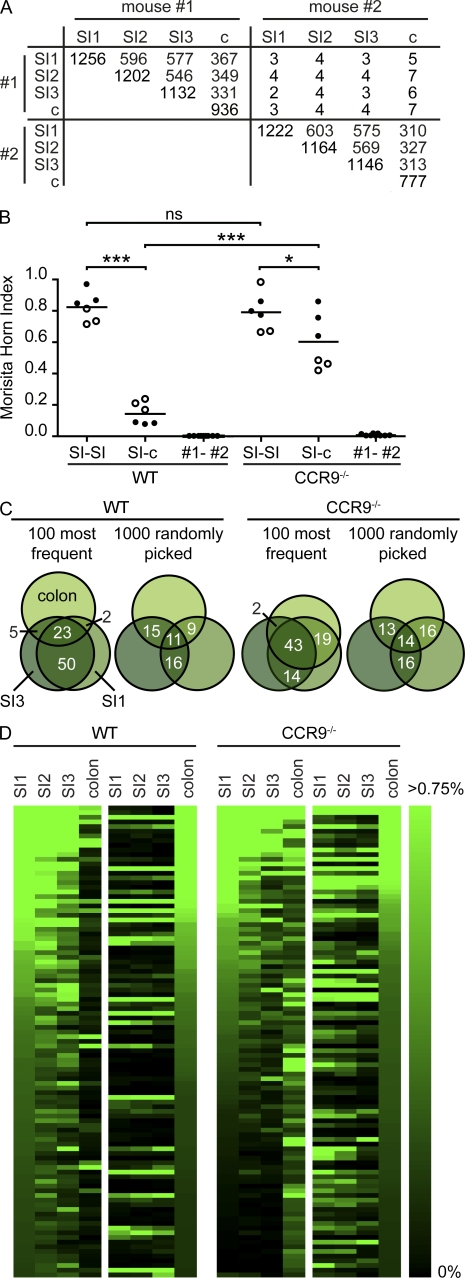
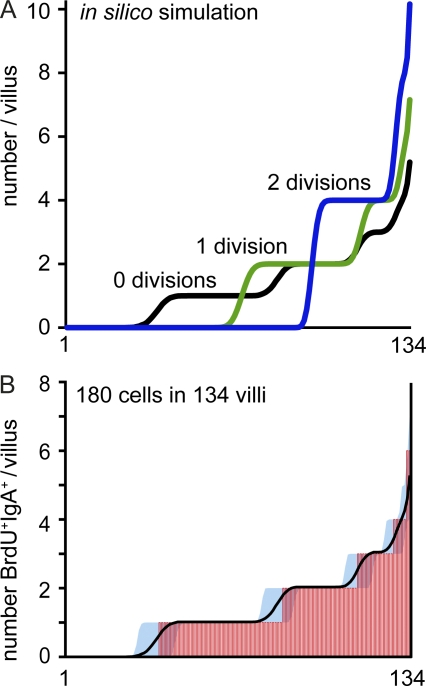
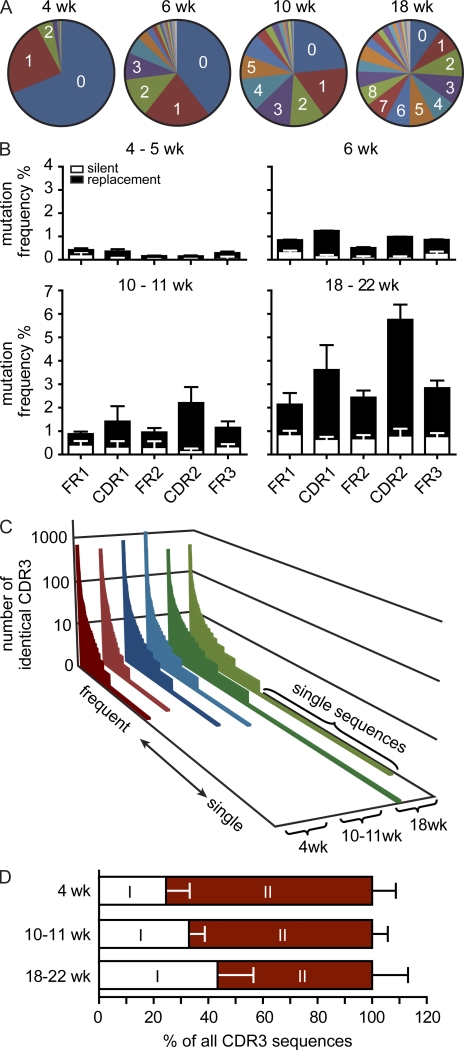
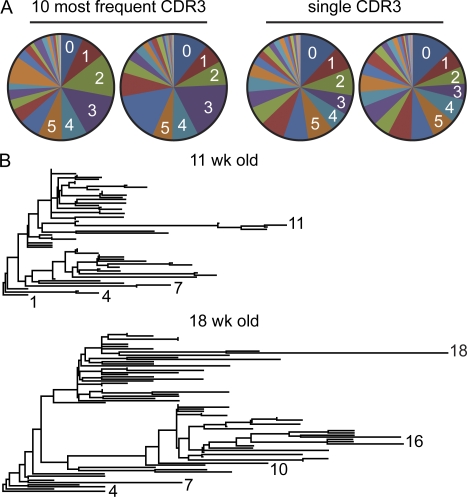
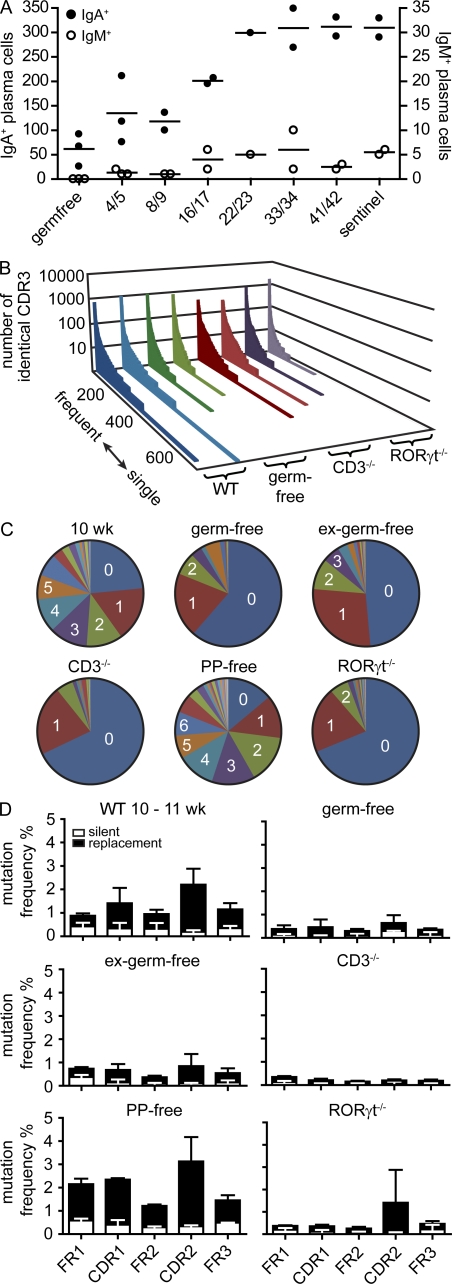
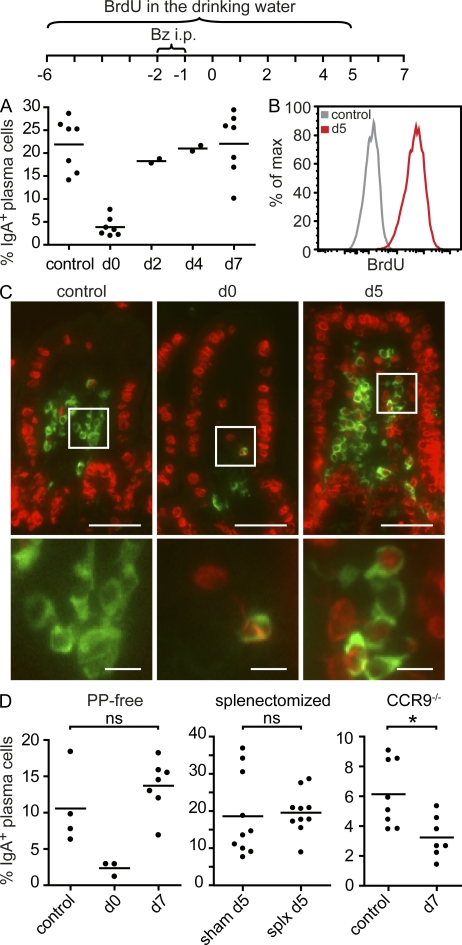
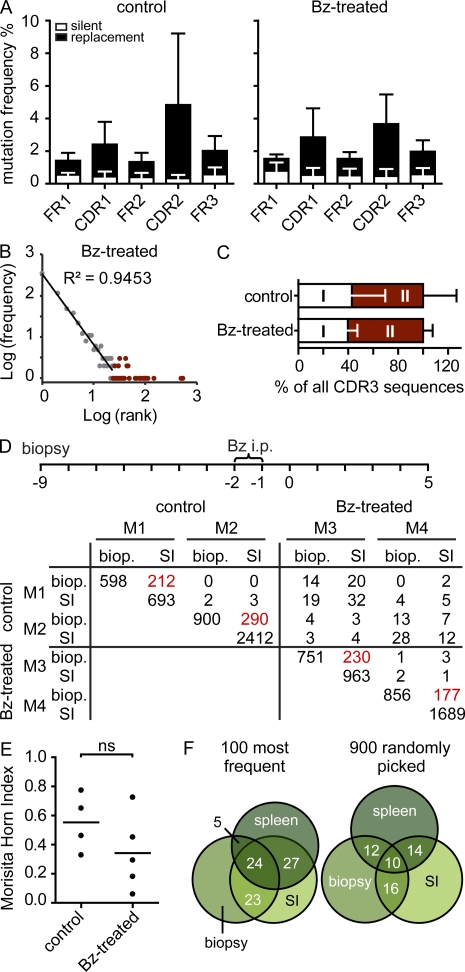
Intestinal immunoglobulin A (IgA) ensures host defense and symbiosis with our commensal microbiota. Yet previous studies hint at a surprisingly low diversity of intestinal IgA, and it is unknown to what extent the diverse Ig arsenal generated by somatic recombination and diversification is actually used. In this study, we analyze more than one million mouse IgA sequences to describe the shaping of the intestinal IgA repertoire, its determinants, and stability over time. We show that expanded and infrequent clones combine to form highly diverse polyclonal IgA repertoires with very little overlap between individual mice. Selective homing allows expanded clones to evenly seed the small but not large intestine. Repertoire diversity increases during aging in a dual process. On the one hand, microbiota-, T cell-, and transcription factor RORγt-dependent but Peyer's patch-independent somatic mutations drive the diversification of expanded clones, and on the other hand, new clones are introduced into the repertoire of aged mice. An individual's IgA repertoire is stable and recalled after plasma cell depletion, which is indicative of functional memory. These data provide a conceptual framework to understand the dynamic changes in the IgA repertoires to match environmental and intrinsic stimuli.


Figures

Figure 1.
Figure 1.
The IgA repertoire comprises highly expanded and low frequency clones. (A) In a set of 5,000 sequences, all different CDR3 sequences were listed along the x axis from frequent to single sequences, and the number of sequence reads for each different CDR3 sequence were displayed on the y axis. Each slice represents an independently analyzed mouse. (B) Log(frequency) versus log(rank) diagram for one representative mouse reveals two components of the CDR3 population. A first component (I) follows power law characteristics and comprises clones present at low frequency. A second component (II) comprises highly expanded clones and appears as a long tail in the diagram and is marked in red. (C) Bars depict the contribution of both components to all CDR3 sequences and different CDR3 sequences (mean + SD). All data are based on the analysis of six 10–11-wk-old C57BL/6 mice housed under SPF conditions. (D) Representative pseudocolor plot demonstrating IgA/CD138 staining gated on live (DAPI) single SI lamina propria cells. (E) Log(frequency) versus log(rank) diagram of 5,000 CDR3 sequences obtained from sorted IgA+CD138+ plasma cells pooled from two 10-wk-old C57BL/6 mice. Results are representative of four independent experiments performed.
Figure 2.
Figure 2.
Individual mice show largely nonoverlapping IgA repertoires in the intestine. (A) In a set of 5,000 sequences per sample, all VDJ combinations were enumerated, and the sequence sets were sorted from most frequent to least frequent as observed in mouse number 1, 3, or 5 (indicated in red). The number of sequence reads assigned to each VDJ combination is indicated by color code. Similarly, sequence sets were sorted according to the frequencies of CDR3 amino acid sequences. Please note that logarithmic transformation was used to generate the color code and even sequences observed only three times are nonblack. (B) CDR3 amino acid and nucleotide sequences were compared between different mice, and the number of identical sequences was enumerated. The number of different CDR3 sequences in a given animal appears in the diagonal of the table. Very few CDR3 sequences were shared between different animals. All data are based on the analysis of six 10–11-wk-old C57BL/6 mice housed under SPF conditions.
Figure 3.
Figure 3.
Identical CDR3 sequences seed different fragments of the SI. (A) Nucleotide CDR3 sequences were compared between proximal jejunum (SI1), distal jejunum (SI2), ileum (SI3), and colon (c) of 13-wk-old C57BL/6 mice, and the number of identical sequences was enumerated. Data are based on 10,000 sequences per sample, and the number of different CDR3 sequences in each sample appears in the diagonal of the table. (B) MHIs were calculated comparing CDR3 sequence pools obtained from various gut fragments in WT and CCR9−/− mice (WT, n = 2; CCR9−/−, n = 2). Individual mice are indicated by open and closed symbols, and comparisons calculated are SI1 to SI2, SI1 to SI3, and SI2 to SI3 to describe similarity of SI fragments and SI1 to c, SI2 to c, and SI3 to c for comparison of SI- and large intestine–derived sequence pools. Comparison of CDR3 sequence pools between different mice yields MHIs close to 0 (first and second columns). Horizontal lines indicate the mean. *, P < 0.05; ***, P < 0.001. (C) Venn diagrams illustrate the overlap of CDR3 sequence pools from SI1, SI3, and colon in one WT and one CCR9−/− mouse. Numbers indicate overlap in percentages. (D) 10,000 CDR3 sequences from SI1, SI2, SI3, and colon were sorted according to their frequency in SI1 (WT, left) or colon (WT, right). Because overlap of sequence sets is driven by expanded sequences, we limited our analysis to the 100 most frequent sequences and visualized their frequency (in percentages of all sequences) by color codes. Note that upon sorting according to frequency in the proximal jejunum, more sequences with similarly high frequency could be found in CCR9−/− mice than in WT mice.
Figure 4.
Figure 4.
Newly generated plasma cells are evenly distributed in the gut mucosa. (A) A random distribution of 180 cells throughout 134 individual villi was predicted by in silico simulation assuming no (black), one (green), or two (blue) cell divisions. (B) Mice received BrdU continuously with the drinking water for 7 d, and the number of BrdU+IgA+ cells in individual villi was enumerated by immunofluorescence microscopy. Inspecting 134 villi (pooled from five mice), we found 180 BrdU+IgA+ cells. The x axis corresponds to individual villi sorted from villi containing no cells to villi containing multiple BrdU+IgA+ cells, and each villus is represented by a vertical red line. Mean and 95% confidence interval of the in silico simulation with no cell divisions are depicted by a black line and blue-filled area. Similar results were observed after 2 d of BrdU application.
Figure 5.
Figure 5.
IgA repertoire diversity increases with age. (A) Diagrams depict the number of SMs observed in representative 4-, 6-, 10-, and 18-wk-old mice. (B) Bars depict mean + SD SM frequencies in FR1, FR2, FR3, CDR1, and CDR2 observed in the following number of animals: 4–5 wk, n = 4; 6 wk, n = 2; 10–11 wk, n = 6; and 18–22 wk, n = 5. (C) CDR3 sequences were sorted by rank, from high to low frequency, and the number of identical sequences was plotted (compare with Fig. 1 A). Please note that the number of unique sequences increased with age. (D) Bars depict the contribution of both components to all CDR3 sequences (mean + SD).
Figure 6.
Figure 6.
Expanded clones accumulated extensive SMs. (A) Diagrams depict the frequencies of SMs in two representative 18-wk-old mice (out of five 18–22-wk-old mice analyzed) in sequences comprising the 10 most frequent CDR3 sequences or in VH sequences carrying CDR3 sequences that were present only once in a set of 17,000 (left) and 23,000 (right) sequences. (B) Phylogram demonstrating clonal relationship of the most frequent CDR3 sequences in one representative 11- and 18-wk-old mouse. Numbers indicate the number of SMs in selected sequences.
Figure 7.
Figure 7.
SHM requires T cells, microbiota, and RORγt but not PPs. (A) Germ-free mice were colonized by cohousing with sentinels raised under SPF conditions for the indicated number of days. Symbols indicate the total number of IgA+ and IgM+ cells in individual mice observed by histology counting six fields of view from at least three different sections per mouse covering different fragments of the SI. Horizontal lines indicate the mean. (B) In a set of 5,000 sequences, all different CDR3 sequences were listed along the x axis from frequent to single sequences, and the number of sequence reads for each different CDR3 sequence was displayed on the y axis. Each slice represents an independently performed experiment as indicated. (C) Diagrams depict the number of SMs observed in representative 10-wk-old WT (see Fig. 5), germ-free, ex–germ-free, CD3−/−, PP-free, and RORγt−/− mice. (D) Bars depict mean + SD SM frequencies in FR1, FR2, FR3, CDR1, and CDR2 observed in the following number of animals: 10–11-wk-old WT mice (n = 6; identical to data in Fig. 5 B and shown to improved readability), germ-free mice (9 wk; n = 2), ex–germ-free mice (11 wk; n = 2), CD3−/− mice (10 wk; n = 3), mice lacking PPs (12 wk; n = 2), and RORγt−/− mice (20 wk; n = 2). For IgA sequences from PP-free mice, RNA was isolated out of sorted IgA+CD138+ intestinal plasma cells. For each mouse, a minimum of 10,000 sequences were analyzed.
Figure 8.
Figure 8.
Intestinal IgA-secreting plasma cell numbers rapidly recover after depletion. (A) Mice were injected i.p. on two consecutive days with Bortezomib (Bz), lamina propria cells were isolated, and IgA-secreting plasma cells were quantified by ELISPOT on days 0, 2, 4, and 7 as indicated. Circles represent individual mice analyzed and pooled from two or more experiments, and horizontal lines indicate the mean. (B) Mice received BrdU with the drinking water starting 6 d before Bortezomib injection as indicated. Lamina propria cells were isolated, and the frequency of BrdU+ cells among CD138+IgA+ cells was determined by flow cytometry. Control mice did not receive BrdU. (C) SI tissue was embedded in paraffin, sectioned, and immunostained for IgA (green) and BrdU (red). Images are representative of at least five mice analyzed in two independent experiments. Boxed areas are shown at higher magnification in the bottom panels. Bars: (top) 50 µm; (bottom) 10 µm. (D) Plasma cell numbers rapidly recover after depletion in PP-deficient mice and splenectomized mice but not in CCR9−/− mice. Mice received two consecutive injections of Bortezomib, and plasma cell numbers were quantified by ELISPOT in nondepleted mice and at days 0, 5, or 7 after depletion as depicted. Symbols represent individual mice pooled from at least two experiments. Horizontal lines indicate the mean. *, P < 0.05.
Figure 9.
Figure 9.
Identical specificities were recalled after plasma cell depletion. (A) Bars depict mean + SD SM frequencies in FR1, FR2, FR3, CDR1, and CDR2 present in mice after plasma cell depletion or without depletion (four to five mice per group). (B) Representative log(frequency) versus log(rank) diagram of 5,000 CDR3 sequences. (C) Bars depict the contribution of both components to all CDR3 sequences (mean + SD). (D) 10,000 CDR3 sequences were compared between SI biopsies (biop) and SI of two control and two Bortezomib (Bz)-treated mice, and the number of identical CDR3 sequences was enumerated. Overlap of biopsy and SI from the same mouse is highlighted by red numbers. (E) MHIs were calculated comparing CDR3 sequences from the biopsies with the corresponding SI. Mice were 11–15 wk old at the time of sacrifice. Horizontal lines indicate the mean. (F) Venn diagrams illustrate percent overlap of the 100 most frequent CDR3 sequences and 900 randomly picked unique sequences from the SI, biopsy, and spleen of one untreated mouse.

Similar articles

Cited by

References

    1. Asahi Y., Yoshikawa T., Watanabe I., Iwasaki T., Hasegawa H., Sato Y., Shimada S., Nanno M., Matsuoka Y., Ohwaki M., et al. 2002. Protection against influenza virus infection in polymeric Ig receptor knockout mice immunized intranasally with adjuvant-combined vaccines. J. Immunol. 168:2930–2938 - PubMed
    1. Barone F., Vossenkamper A., Boursier L., Su W., Watson A., John S., Dunn-Walters D.K., Fields P., Wijetilleka S., Edgeworth J.D., Spencer J. 2011. IgA-producing plasma cells originate from germinal centers that are induced by B-cell receptor engagement in humans. Gastroenterology. 140:947–956 10.1053/j.gastro.2010.12.005 - DOI - PMC - PubMed
    1. Benckert J., Schmolka N., Kreschel C., Zoller M.J., Sturm A., Wiedenmann B., Wardemann H. 2011. The majority of intestinal IgA+ and IgG+ plasmablasts in the human gut are antigen-specific. J. Clin. Invest. 121:1946–1955 10.1172/JCI44447 - DOI - PMC - PubMed
    1. Brandtzaeg P. 2009. Mucosal immunity: Induction, dissemination, and effector functions. Scand. J. Immunol. 70:505–515 10.1111/j.1365-3083.2009.02319.x - DOI - PubMed
    1. Brandtzaeg P., Johansen F.E. 2005. Mucosal B cells: Phenotypic characteristics, transcriptional regulation, and homing properties. Immunol. Rev. 206:32–63 10.1111/j.0105-2896.2005.00283.x - DOI - PubMed

Publication types

MeSH terms