

Physician patient-sharing networks and the cost and intensity of care in US hospitals
- PMID: 22249922
- PMCID: PMC3260449
- DOI: 10.1097/MLR.0b013e31822dcef7
Physician patient-sharing networks and the cost and intensity of care in US hospitals
Abstract
Background: There is substantial variation in the cost and intensity of care delivered by US hospitals. We assessed how the structure of patient-sharing networks of physicians affiliated with hospitals might contribute to this variation.
Methods: We constructed hospital-based professional networks based on patient-sharing ties among 61,461 physicians affiliated with 528 hospitals in 51 hospital referral regions in the US using Medicare data on clinical encounters during 2006. We estimated linear regression models to assess the relationship between measures of hospital network structure and hospital measures of spending and care intensity in the last 2 years of life.
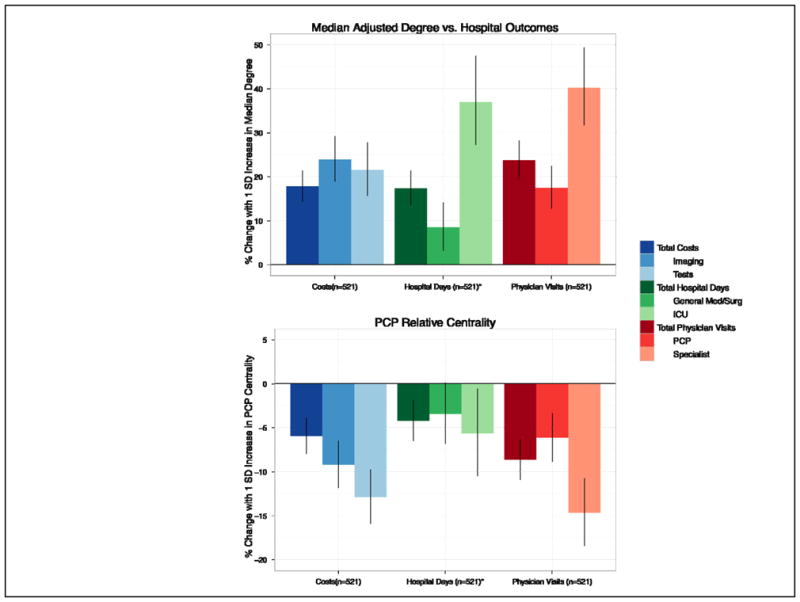
Results: The typical physician in an average-sized urban hospital was connected to 187 other doctors for every 100 Medicare patients shared with other doctors. For the average-sized urban hospital an increase of 1 standard deviation (SD) in the median number of connections per physician was associated with a 17.8% increase in total spending, in addition to 17.4% more hospital days, and 23.8% more physician visits (all P<0.001). In addition, higher "centrality" of primary care providers within these hospital networks was associated with 14.7% fewer medical specialist visits (P<0.001) and lower spending on imaging and tests (-9.2% and -12.9% for 1 SD increase in centrality, P<0.001).
Conclusions: Hospital-based physician network structure has a significant relationship with an institution's care patterns for their patients. Hospitals with doctors who have higher numbers of connections have higher costs and more intensive care, and hospitals with primary care-centered networks have lower costs and care intensity.
Figures
Similar articles
-
Patient-Sharing Networks of Physicians and Health Care Utilization and Spending Among Medicare Beneficiaries.JAMA Intern Med. 2018 Jan 1;178(1):66-73. doi: 10.1001/jamainternmed.2017.5034. JAMA Intern Med. 2018. PMID: 29181504 Free PMC article.
-
Association of Financial Integration Between Physicians and Hospitals With Commercial Health Care Prices.JAMA Intern Med. 2015 Dec;175(12):1932-9. doi: 10.1001/jamainternmed.2015.4610. JAMA Intern Med. 2015. PMID: 26501217
-
Is provider capitation working? Effects on physician-hospital integration and costs of care.Med Care. 2000 Mar;38(3):311-24. doi: 10.1097/00005650-200003000-00008. Med Care. 2000. PMID: 10718356
-
The effects of hospital-physician integration strategies on hospital financial performance.Health Serv Res. 1995 Oct;30(4):507-30. Health Serv Res. 1995. PMID: 7591779 Free PMC article. Review.
-
Evidence Brief: The Quality of Care Provided by Advanced Practice Nurses [Internet].Washington (DC): Department of Veterans Affairs (US); 2014 Sep. Washington (DC): Department of Veterans Affairs (US); 2014 Sep. PMID: 27606392 Free Books & Documents. Review.
Cited by
-
Measuring racial segregation in health system networks using the dissimilarity index.Soc Sci Med. 2019 Nov;240:112570. doi: 10.1016/j.socscimed.2019.112570. Epub 2019 Sep 25. Soc Sci Med. 2019. PMID: 31585377 Free PMC article.
-
Association of Physician Peer Influence With Subsequent Physician Adoption and Use of Bevacizumab.JAMA Netw Open. 2020 Jan 3;3(1):e1918586. doi: 10.1001/jamanetworkopen.2019.18586. JAMA Netw Open. 2020. PMID: 31899533 Free PMC article.
-
Characterizing communication patterns among members of the clinical care team to deliver breast cancer treatment.J Am Med Inform Assoc. 2020 Feb 1;27(2):236-243. doi: 10.1093/jamia/ocz151. J Am Med Inform Assoc. 2020. PMID: 31682267 Free PMC article.
-
A measure of local uniqueness to identify linchpins in a social network with node attributes.Appl Netw Sci. 2021;6:56. doi: 10.1007/s41109-021-00400-8. Epub 2021 Jul 17. Appl Netw Sci. 2021. PMID: 34938853 Free PMC article.
-
Big data and new knowledge in medicine: the thinking, training, and tools needed for a learning health system.Health Aff (Millwood). 2014 Jul;33(7):1163-70. doi: 10.1377/hlthaff.2014.0053. Health Aff (Millwood). 2014. PMID: 25006142 Free PMC article.
References
-
- Fisher ES, Wennberg DE, Stukel TA, Gottlieb DJ, Lucas FL, Pinder EL. The implications of regional variations in Medicare spending. Part 1: health outcomes and satisfaction with care. Ann Intern Med. 2003;138:273–87. - PubMed
-
- Committee MPA. Report to Congress: measuring regional variation in service use. Washington, DC: MEDPAC; 2009.
-
- Zuckerman S, Waidmann T, Berenson R, Hadley J. Clarifying sources of geographic differences in Medicare spending. N Engl J Med. 2010;363:54–62. - PubMed
Publication types
MeSH terms
Grants and funding
LinkOut - more resources
Full Text Sources
