

S-glutathionylation of troponin I (fast) increases contractile apparatus Ca2+ sensitivity in fast-twitch muscle fibres of rats and humans
- PMID: 22250211
- PMCID: PMC3382333
- DOI: 10.1113/jphysiol.2011.224535
S-glutathionylation of troponin I (fast) increases contractile apparatus Ca2+ sensitivity in fast-twitch muscle fibres of rats and humans
Abstract
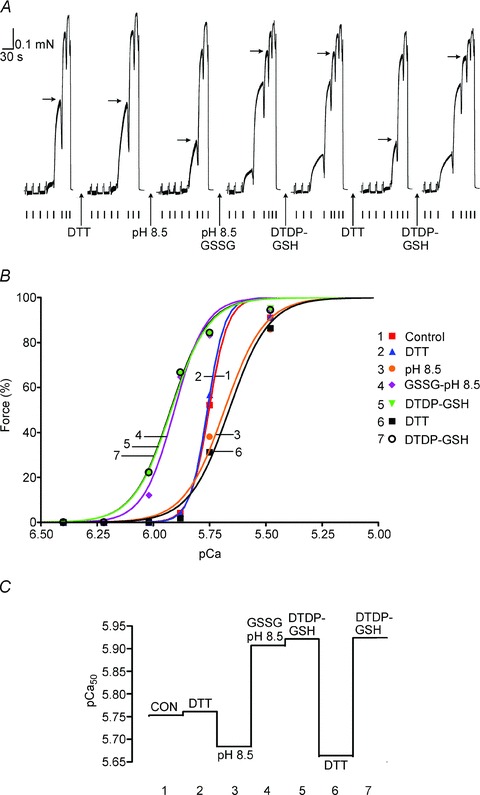
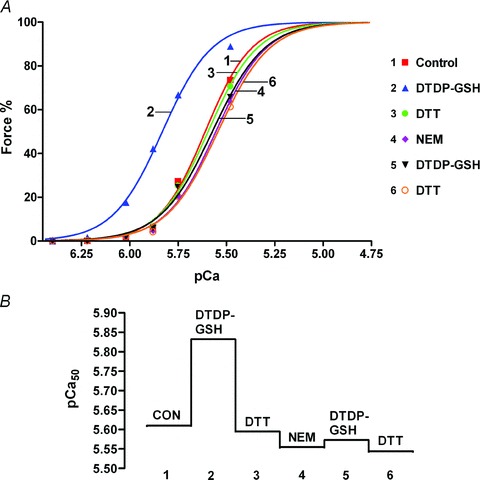
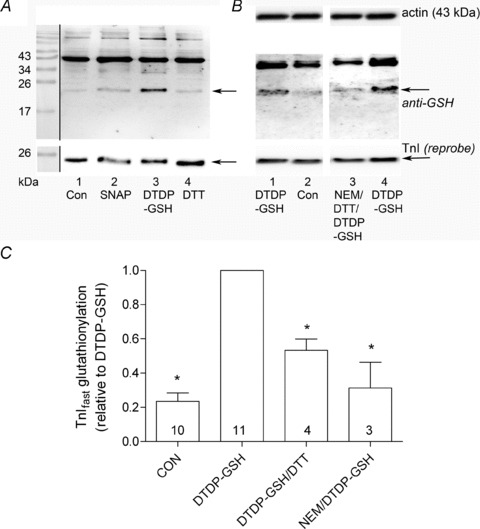
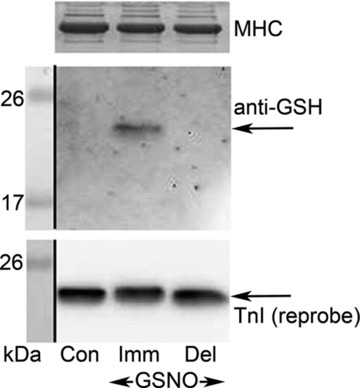
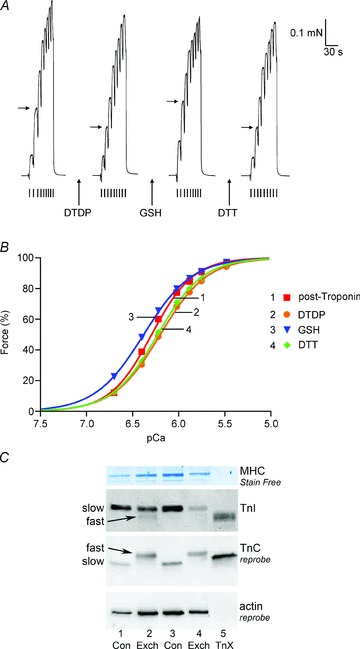
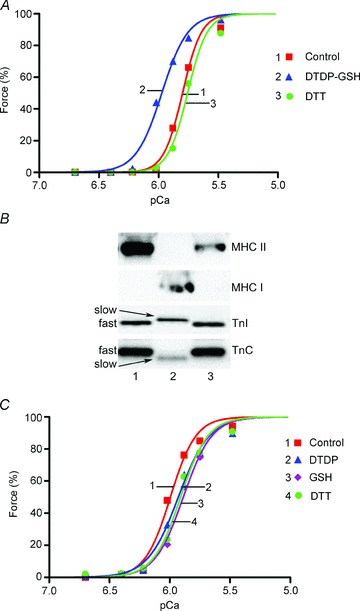
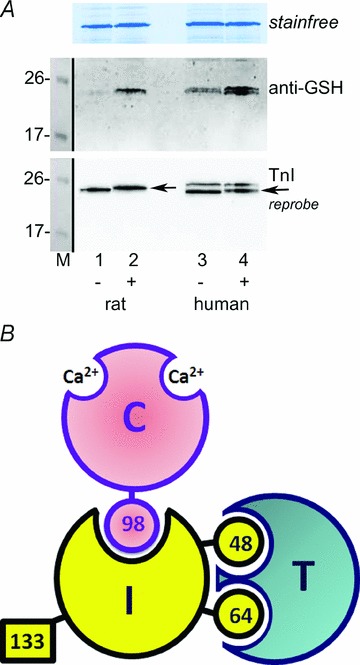
Oxidation can decrease or increase the Ca2+ sensitivity of the contractile apparatus in rodent fast-twitch (type II) skeletal muscle fibres, but the reactions and molecular targets involved are unknown. This study examined whether increased Ca2+ sensitivity is due to S-glutathionylation of particular cysteine residues. Skinned muscle fibres were directly activated in heavily buffered Ca2+ solutions to assess contractile apparatus Ca2+ sensitivity. Rat type II fibres were subjected to S-glutathionylation by successive treatments with 2,2′-dithiodipyridine (DTDP) and glutathione (GSH), and displayed a maximal increase in pCa50 (−log10 [Ca2+] at half-maximal force) of ∼0.24 pCa units, with little or no effect on maximum force or Hill coefficient. Partial similar effect was produced by exposure to oxidized gluthathione (GSSG, 10 mM) for 10 min at pH 7.1, and near-maximal effect by GSSG treatment at pH 8.5. None of these treatments significantly altered Ca2+ sensitivity in rat type I fibres. Western blotting showed that both the DTDP–GSH and GSSG–pH 8.5 treatments caused marked S-glutathionylation of the fast troponin I isoform (TnI(f)) present in type II fibres, but not of troponin C (TnC) or myosin light chain 2. Both the increased Ca2+ sensitivity and glutathionylation of TnI(f) were blocked by N-ethylmaleimide (NEM). S-nitrosoglutathione (GSNO) also increased Ca2+ sensitivity, but only in conditions where it caused S-glutathionylation of TnI(f). In human type II fibres from vastus lateralis muscle, DTDP–GSH treatment also caused similar increased Ca2+ sensitivity and S-glutathionylation of TnI(f). When the slow isoform of TnI in type I fibres of rat was partially substituted (∼30%) with TnI(f), DTDP–GSH treatment caused a significant increase in Ca2+ sensitivity (∼0.08 pCa units). TnIf in type II fibres from toad and chicken muscle lack Cys133 present in mammalian TnIf, and such fibres showed no change in Ca2+ sensitivity with DTDP–GSH nor any S-glutathionylation of TnI(f) (latter examined only in toad). Following 40 min of cycling exercise in human subjects (at ∼60% peak oxygen consumption), TnI(f) in vastus lateralis muscle displayed a marked increase in S-glutathionylation (∼4-fold). These findings show that S-glutathionylation of TnI(f), most probably at Cys133, increases the Ca2+ sensitivity of the contractile apparatus, and that this occurs in exercising humans, with likely beneficial effects on performance.
Figures

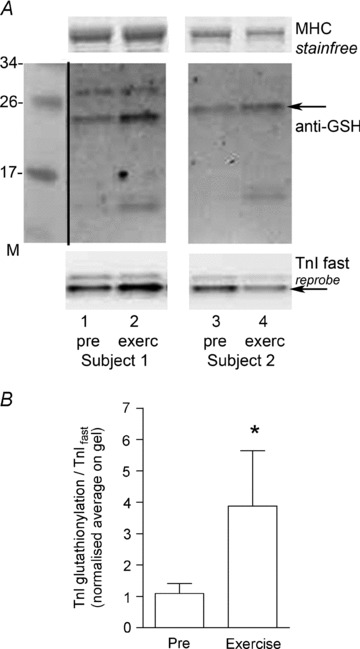
 (‘exerc’). The anti-GSH signal indicated by arrow overlaid with the TnIf bands (lower of the two TnI bands). Increased glutathionylation was also evident at ∼14 kDa in these two post-exercise cases. Top panel shows corresponding MHC bands imaged in stain-free gel before protein transfer. 4–20% Criterion Stain Free gel. B, mean data (+SEM) from 5 subjects for the TnIf
S-glutathionylation signal before and after exercise (all samples run on same gel, repeated three times). The density of each TnIf glutathionylation signal was first normalised by the corresponding TnIf band density, and then each value was re-expressed relative to the mean of the pre-exercise cases on that gel (effectively declaring latter as ‘1’); values from 3 repetitions averaged to yield a single value for each pre- and post-exercise sample for each subject. *Significantly greater than ‘pre’ (paired t test, n= 5 subjects, P < 0.05, one-sided Wilcoxin signed rank test).
(‘exerc’). The anti-GSH signal indicated by arrow overlaid with the TnIf bands (lower of the two TnI bands). Increased glutathionylation was also evident at ∼14 kDa in these two post-exercise cases. Top panel shows corresponding MHC bands imaged in stain-free gel before protein transfer. 4–20% Criterion Stain Free gel. B, mean data (+SEM) from 5 subjects for the TnIf
S-glutathionylation signal before and after exercise (all samples run on same gel, repeated three times). The density of each TnIf glutathionylation signal was first normalised by the corresponding TnIf band density, and then each value was re-expressed relative to the mean of the pre-exercise cases on that gel (effectively declaring latter as ‘1’); values from 3 repetitions averaged to yield a single value for each pre- and post-exercise sample for each subject. *Significantly greater than ‘pre’ (paired t test, n= 5 subjects, P < 0.05, one-sided Wilcoxin signed rank test).Similar articles
-
S-nitrosylation and S-glutathionylation of Cys134 on troponin I have opposing competitive actions on Ca2+ sensitivity in rat fast-twitch muscle fibers.Am J Physiol Cell Physiol. 2017 Mar 1;312(3):C316-C327. doi: 10.1152/ajpcell.00334.2016. Epub 2016 Dec 14. Am J Physiol Cell Physiol. 2017. PMID: 27974300
-
Effects of oxidation and reduction on contractile function in skeletal muscle fibres of the rat.J Physiol. 2003 Jan 1;546(Pt 1):149-63. doi: 10.1113/jphysiol.2002.027896. J Physiol. 2003. PMID: 12509485 Free PMC article.
-
Effects of reducing agents and oxidants on excitation-contraction coupling in skeletal muscle fibres of rat and toad.J Physiol. 1996 Nov 1;496 ( Pt 3)(Pt 3):809-25. doi: 10.1113/jphysiol.1996.sp021729. J Physiol. 1996. PMID: 8930846 Free PMC article.
-
Modulation of contractile apparatus Ca2+ sensitivity and disruption of excitation-contraction coupling by S-nitrosoglutathione in rat muscle fibres.J Physiol. 2011 May 1;589(Pt 9):2181-96. doi: 10.1113/jphysiol.2010.200451. Epub 2010 Nov 29. J Physiol. 2011. PMID: 21115647 Free PMC article.
-
Evidence for a Non-Genomic Action of Testosterone in Skeletal Muscle Which may Improve Athletic Performance: Implications for the Female Athlete.J Sports Sci Med. 2012 Sep 1;11(3):363-70. J Sports Sci Med. 2012. PMID: 24149341 Free PMC article. Review.
Cited by
-
S-glutathionylation, friend or foe in cardiovascular health and disease.Redox Biol. 2020 Oct;37:101693. doi: 10.1016/j.redox.2020.101693. Epub 2020 Aug 22. Redox Biol. 2020. PMID: 32912836 Free PMC article. Review.
-
Effects of high-intensity intermittent exercise on the contractile properties of human type I and type II skeletal muscle fibers.J Appl Physiol (1985). 2020 May 1;128(5):1207-1216. doi: 10.1152/japplphysiol.00014.2020. Epub 2020 Mar 26. J Appl Physiol (1985). 2020. PMID: 32213115 Free PMC article.
-
Diaphragm plasticity in aging and disease: therapies for muscle weakness go from strength to strength.J Appl Physiol (1985). 2018 Aug 1;125(2):243-253. doi: 10.1152/japplphysiol.01059.2017. Epub 2018 Apr 19. J Appl Physiol (1985). 2018. PMID: 29672230 Free PMC article. Review.
-
Antioxidant treatments do not improve force recovery after fatiguing stimulation of mouse skeletal muscle fibres.J Physiol. 2015 Jan 15;593(2):457-72. doi: 10.1113/jphysiol.2014.279398. Epub 2014 Dec 11. J Physiol. 2015. PMID: 25630265 Free PMC article.
-
Levels of inflammation and oxidative stress, and a role for taurine in dystropathology of the Golden Retriever Muscular Dystrophy dog model for Duchenne Muscular Dystrophy.Redox Biol. 2016 Oct;9:276-286. doi: 10.1016/j.redox.2016.08.016. Epub 2016 Aug 30. Redox Biol. 2016. PMID: 27611888 Free PMC article.
References
-
- Aihara T, Ueki S, Nakamura M, Arata T. Calcium-dependent movement of troponin I between troponin C and actin as revealed by spin-labeling EPR. Biochem Biophys Res Commun. 2006;340:462–468. - PubMed
-
- Allen DG, Lamb GD, Westerblad H. Skeletal muscle fatigue: cellular mechanisms. Physiol Rev. 2008;88:287–332. - PubMed
-
- Andrade FH, Reid MB, Westerblad H. Contractile response of skeletal muscle to low peroxide concentrations: myofibrillar calcium sensitivity as a likely target for redox-modulation. FASEB J. 2001;15:309–311. - PubMed
Publication types
MeSH terms
Substances
LinkOut - more resources
Full Text Sources
Other Literature Sources
Miscellaneous