

Assay dilution factors confound measures of total antioxidant capacity in polyphenol-rich juices
- PMID: 22251245
- PMCID: PMC5012105
- DOI: 10.1111/j.1750-3841.2011.02538.x
Assay dilution factors confound measures of total antioxidant capacity in polyphenol-rich juices
Abstract
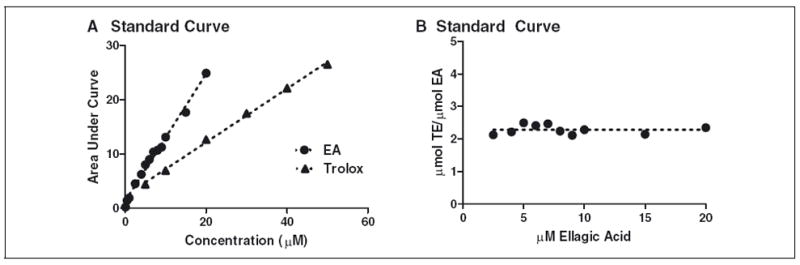
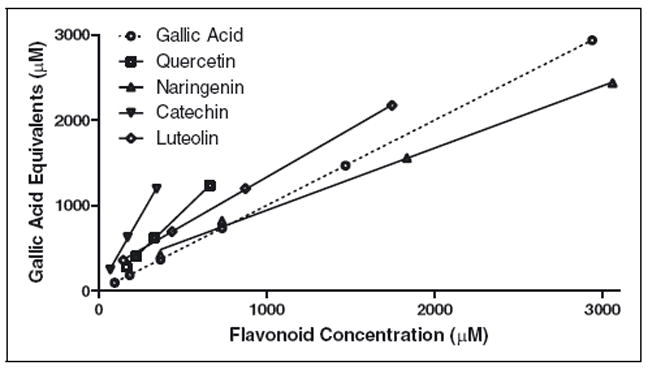
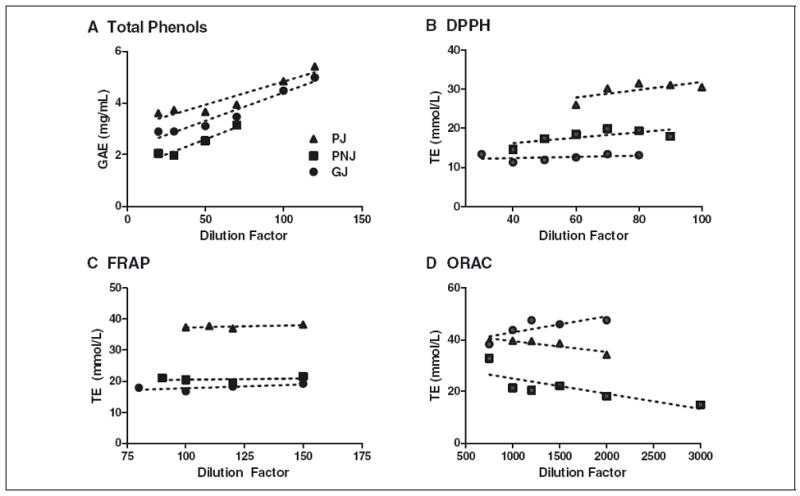
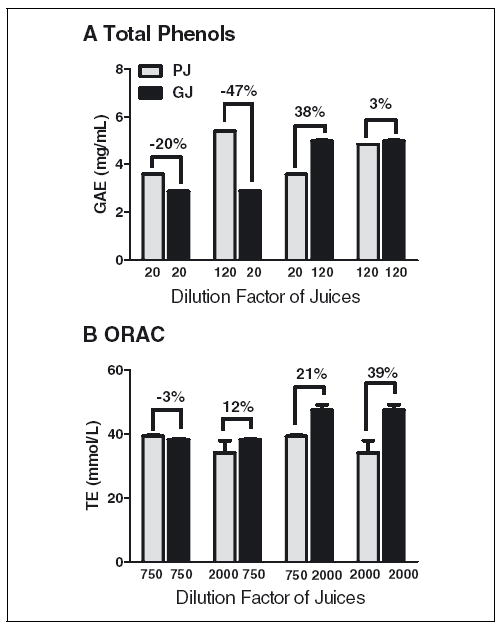
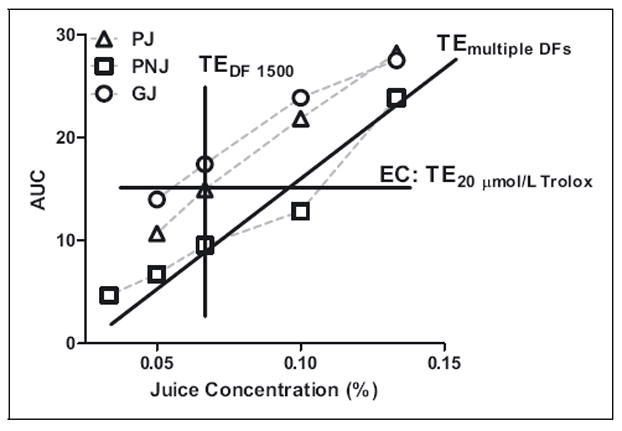
The extent to which sample dilution factor (DF) affects total antioxidant capacity (TAC) values is poorly understood. Thus, we examined the impact of DF on the ORAC, FRAP, DPPH, and total phenols (TP) assays using pomegranate juice (PJ), grape juice (GJ), selected flavonoids, ascorbic acid, and ellagic acid. For ORAC, GJ was comparable to PJ at DF 750, but at DF 2000, the ORAC value of GJ was 40% more than PJ. Increasing DF increased GJ and PJ, DPPH, TP, and FRAP values 11% and 14%, respectively. Increased test concentrations of quercetin and catechin resulted in 51% and 126% greater ORAC values, but decreased naringenin by 68%. Flavonoids, but not ellagic acid or ascorbic acid, may contribute to the dilution effect on the variation of final TAC values. Thus, reporting TAC or TP using a single DF may introduce uncertainty about the confidence of TAC assay values, especially when comparing different juices. These results underscore the importance of using compatible test standards for reporting TAC values.
Practical application: Total antioxidant capacity (TAC) values such as the ORAC assay are increasingly used for comparison of polyphenol-rich foods and beverages. Choice of standards and test concentrations, even within the linear range of standards, may introduce variation probably due to synergy/antagonism between antioxidant and thereby, confound final TAC values. Thus, test concentration or dilution factors of samples should be considered in the design of TAC assays and interpretation of their results.
© 2012 Institute of Food Technologists®
Figures
Similar articles
-
Contributions of phenolics and added vitamin C to the antioxidant capacity of pomegranate and grape juices: synergism and antagonism among constituents.Int J Food Sci Technol. 2013 Dec 1;48(12):10.1111/ijfs.12261. doi: 10.1111/ijfs.12261. Int J Food Sci Technol. 2013. PMID: 24187439 Free PMC article.
-
ORAC and DPPH assay comparison to assess antioxidant capacity of tea infusions: relationship between total polyphenol and individual catechin content.Int J Food Sci Nutr. 2010 Mar;61(2):109-24. doi: 10.3109/09637480903292601. Int J Food Sci Nutr. 2010. PMID: 20109129
-
Comparison of antioxidant potency of commonly consumed polyphenol-rich beverages in the United States.J Agric Food Chem. 2008 Feb 27;56(4):1415-22. doi: 10.1021/jf073035s. Epub 2008 Jan 26. J Agric Food Chem. 2008. PMID: 18220345
-
Fruit maturity and juice extraction influences ellagic acid derivatives and other antioxidant polyphenolics in muscadine grapes.J Agric Food Chem. 2004 Jan 28;52(2):361-6. doi: 10.1021/jf034971k. J Agric Food Chem. 2004. PMID: 14733522
-
Comparison of the polyphenolic composition and antioxidant activity of European commercial fruit juices.Food Funct. 2010 Oct;1(1):73-83. doi: 10.1039/c0fo00008f. Epub 2010 Sep 13. Food Funct. 2010. PMID: 21776457
Cited by
-
Polyphenol-Rich Extracts Obtained from Winemaking Waste Streams as Natural Ingredients with Cosmeceutical Potential.Antioxidants (Basel). 2019 Sep 1;8(9):355. doi: 10.3390/antiox8090355. Antioxidants (Basel). 2019. PMID: 31480581 Free PMC article.
-
Contributions of phenolics and added vitamin C to the antioxidant capacity of pomegranate and grape juices: synergism and antagonism among constituents.Int J Food Sci Technol. 2013 Dec 1;48(12):10.1111/ijfs.12261. doi: 10.1111/ijfs.12261. Int J Food Sci Technol. 2013. PMID: 24187439 Free PMC article.
-
Development of genistein-PEGylated silica hybrid nanomaterials with enhanced antioxidant and antiproliferative properties on HT29 human colon cancer cells.Am J Transl Res. 2018 Aug 15;10(8):2306-2323. eCollection 2018. Am J Transl Res. 2018. PMID: 30210672 Free PMC article.
-
Experimental Conditions That Influence the Utility of 2'7'-Dichlorodihydrofluorescein Diacetate (DCFH2-DA) as a Fluorogenic Biosensor for Mitochondrial Redox Status.Antioxidants (Basel). 2022 Jul 22;11(8):1424. doi: 10.3390/antiox11081424. Antioxidants (Basel). 2022. PMID: 35892626 Free PMC article.
-
Diverse Phytochemicals and Bioactivities in the Ancient Fruit and Modern Functional Food Pomegranate (Punica granatum).Molecules. 2017 Sep 25;22(10):1606. doi: 10.3390/molecules22101606. Molecules. 2017. PMID: 28946708 Free PMC article. Review.
References
-
- Adom KK, Liu RH. Rapid peroxyl radical scavenging capacity (PSC) assay for assessing both hydrophilic and lipophilic antioxidants. J Agric Food Chem. 2005;53:6572–80. - PubMed
-
- Balk J. Evaluation of the accuracy of antioxidant competition assays: incorrect assumptions with major impact. Free Rad Biol Med. 2009;47:135–44. - PubMed
-
- Benzie IFF, Strain JJ. The ferric reducing ability of plasma (FRAP) as a measure of “antioxidant power”: the FRAP Assay. Anal Biochem. 1996;239:70–6. - PubMed
-
- Brand-Williams W, Cuvelier ME, Berset C. Use of a free radical method to evaluate antioxidant activity. Leb Wis Tech. 1995;28:25–30.
Publication types
MeSH terms
Substances
Grants and funding
LinkOut - more resources
Full Text Sources
Medical
Miscellaneous
