. 2012 Mar 8;119(10):2314-24.
doi: 10.1182/blood-2011-10-386235. Epub 2012 Jan 17.

Up-regulation of a HOXA-PBX3 homeobox-gene signature following down-regulation of miR-181 is associated with adverse prognosis in patients with cytogenetically abnormal AML

Affiliations

Up-regulation of a HOXA-PBX3 homeobox-gene signature following down-regulation of miR-181 is associated with adverse prognosis in patients with cytogenetically abnormal AML

Zejuan Li et al. Blood. .

Abstract

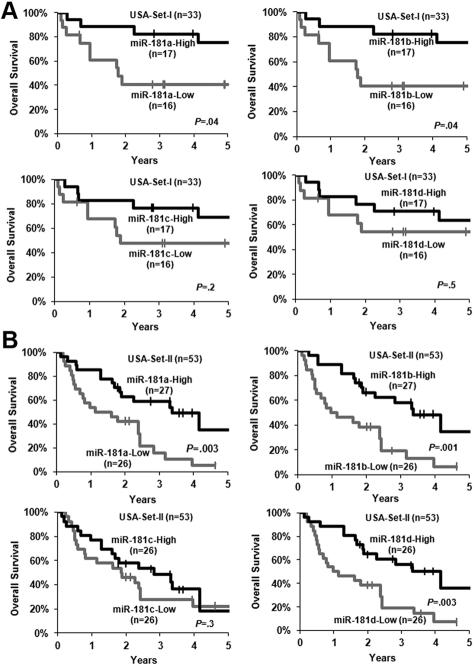
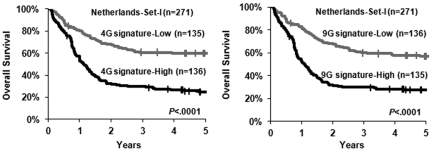
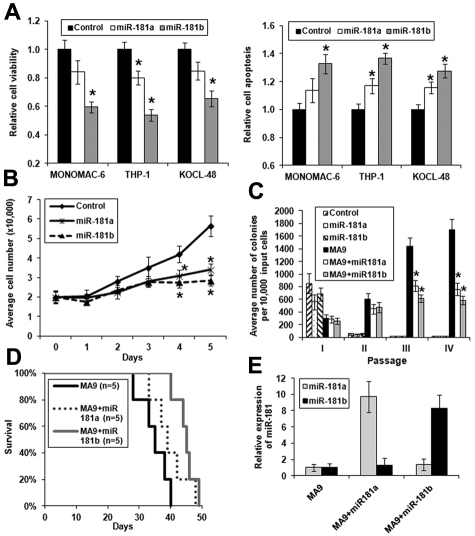
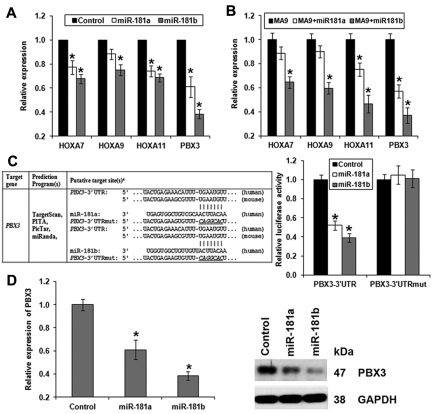
Increased expression levels of miR-181 family members have been shown to be associated with favorable outcome in patients with cytogenetically normal acute myeloid leukemia. Here we show that increased expression of miR-181a and miR-181b is also significantly (P < .05; Cox regression) associated with favorable overall survival in cytogenetically abnormal AML (CA-AML) patients. We further show that up-regulation of a gene signature composed of 4 potential miR-181 targets (including HOXA7, HOXA9, HOXA11, and PBX3), associated with down-regulation of miR-181 family members, is an independent predictor of adverse overall survival on multivariable testing in analysis of 183 CA-AML patients. The independent prognostic impact of this 4-homeobox-gene signature was confirmed in a validation set of 271 CA-AML patients. Furthermore, our in vitro and in vivo studies indicated that ectopic expression of miR-181b significantly promoted apoptosis and inhibited viability/proliferation of leukemic cells and delayed leukemogenesis; such effects could be reversed by forced expression of PBX3. Thus, the up-regulation of the 4 homeobox genes resulting from the down-regulation of miR-181 family members probably contribute to the poor prognosis of patients with nonfavorable CA-AML. Restoring expression of miR-181b and/or targeting the HOXA/PBX3 pathways may provide new strategies to improve survival substantially.


Figures

Figure 1
Figure 1
Increased expression of miR-181 family members is associated with favorable OS. (A) USA-set I (n = 33). (B) USA-set II (n = 53). The patients in each set were dichotomized into 2 groups based on the median value of expression signature of a given miR-181 family member. Kaplan-Meier curves were generated to depict outcomes. The P value was determined by log-rank test. | indicates censored. In USA-set II, miR-181c and miR-181d did not have reliable expression value in 1 patient sample.
Figure 2
Figure 2
Expression levels of miR-181 family members and the 4 homeobox genes can separate favorable subtypes of CA-AML from unfavorable ones. The favorable subtypes of CA-AML carrying t(15;17), t(8;21), or inv(16) exhibited an increased expression of miR-181 family members and a decreased expression of the 4 homeobox genes compared with the poor prognosis subtypes of CA-AML bearing t(11q23) or (+8).
Figure 3
Figure 3
Increased levels of the 4- and 9-gene signatures are associated with adverse OS. The patients in the validation set (ie, Netherlands-set I; n = 271) were dichotomized into 2 groups based on the median value of the 4-gene (4G signature; left panel) or the 9-gene (9G signature; right panel) signature, and then Kaplan-Meier curves were generated to depict outcomes. The P value was determined by log-rank test. | indicates censored.
Figure 4
Figure 4
Ectopic expression of miR-181a and, particularly, miR-181b exhibits anti–tumor effects in MLL-rearranged AML in vitro and in vivo. *P < .05 (2-tailed t test). (A) Effect of ectopic expression of miR-181a and miR-181b on viability (left panel) or apoptosis (right panel) of MONOMAC-6, THP-1, and KOCL-48 cells, respectively. The controls are cells transfected with empty plasmids. Data are mean ± SD from 3 independent experiments. (B) Cell growth/proliferation analysis of MONOMAC-6 cells transfected with MSCV-PIG (ie, control), MSCV-PIG-miR-181a, or MSCV-PIG-miR-181b. Cell growth is significantly (P < .05) slower in leukemic cells transduced with miR-181a or miR-181b than those transduced with empty vector after 3 days of culture. (C) Colony-forming/replating assay of mouse normal BM progenitor cells transduced with MSCVneo + MSCV-PIG (ie, control), MSCVneo + MSCV-PIG-miR-181a (ie, miR-181a), MSCVneo + MSCV-PIG-miR-181b (ie, miR-181b), MSCVneo-MLL-AF9 + MSCV-PIG (ie, MA9), MSCVneo-MLL-AF9 + MSCV-PIG-miR-181a (ie, MA9 + miR181a), or MSCVneo-MLL-AF9 + MSCV-PIG-miR-181b (ie, MA9 + miR181b). Duplicates were plated for each combination with 1 × 10⁴ cells per dish, and every 7 days the cells were replated for up to 4 passages. Two independent experiments were conducted. Data are mean ± SD. (D) In primary mouse bone marrow transplantation (BMT) assay, both MA9 + miR181a mice (n = 5) and MA9 + miR181b mice (n = 5) developed leukemia slower than MA9 (ie, MLL-AF9 alone) mice (n = 5), although only the difference between MA9 + miR181b and MA9 mice is statistically significant (P = .004; log-rank test). (E) Relative expression of miR-181a or miR-181b expression in MA9, MA9 + miR181a, or MA9 + miR181b leukemic mouse BM cells (samples from 3 mice in each cohort were analyzed). The level in MA9 was set as 1.
Figure 5
Figure 5
Forced expression of PBX3 coding region exhibits opposite functions than miR-181a/miR-181b. (A) Forced expression of PBX3-CDS could reverse the effects of miR-181a/miR-181b on viability (left panel) and apoptosis (right panel) of MONOMAC-6, THP-1, and KOCL-48 cells, respectively. (B) Cell growth/proliferation analysis of MONOMAC-6 cells transfected with MSCV-PIG (ie, control), MSCV-PIG-miR-181a, MSCV-PIG-miR-181b, MSCV-PIG-PBX3 (CDS), MSCV-PIG-PBX3 (CDS)–miR181a, or MSCV-PIG-PBX3 (CDS)–miR181b. *P < .05. (C) Western blot assay of expression of PBX3 at the protein level in MONOMAC-6 cells 96 hours after transfection with more than 6 individual constructs. (D) Apoptosis analysis by flow cytometry with anti–annexin V antibody staining in MONOMAC-6 cells 72 hours after transfection with more than 6 individual constructs. PI indicates propidium iodide. Red rectangle indicates apoptotic cells. (E) In secondary BMT assay, mice with MA9 + miR181b (n = 10) developed leukemia significantly (P = .02) slower than those of MA9 alone (n = 5). Mice with MA9 + miR181b + PBX3-CDS (n = 6) developed leukemia at a similar speed as those with MA9 + PBX3-CDS (n = 5), and both faster, although not significantly (P = .06), than MA9 mice (n = 5). (F) Quantitative PCR analysis of miR-181b and PBX3 expression levels in secondary BMT mouse leukemic BM cells. The quantitative PCR primers of PBX3 were designed to detect expression of both human and mouse PBX3. Data are mean ± SD values of 3 mouse BM samples per cohort.
Figure 6
Figure 6
Forced expression of miR-181a/miR-181b represses endogenous expression of the 4 homeobox target genes, and PBX3 is a direct target of miR-181a/miR-181b. (A-B) Quantitative PCR analyses of effects of the ectopic expression of miR-181a or miR-181b on the expression of the 4 homeobox genes (ie, HOXA7, HOXA9, HOXA11, and PBX3) in human MLL-rearranged leukemic cells (A, using MONOMAC-6 cells as a representative) or in MLL-fusion-mediated mouse primary leukemic BM cells (B). Data are mean ± SD. *P < .05. (C) Luciferase reporter and mutagenesis assays. Left panel: Predicted miR-181a/miR-181b target sites and corresponding mutants in the 3′-UTR of PBX3. Right panel: Forced expression of miR-181a or miR-181b can significantly repress luciferase activity of the reporter gene bearing 3′-UTR of PBX3 in human 293T cells, whereas mutation at the putative target site of miR-181 in the 3′-UTR can abrogate the inhibition. The normalized luciferase activities represent the firefly: β-Galactosidase ratios normalized to the control sample. Error bars present SD obtained from 3 independent experiments. (D) Quantitative PCR (left panel) and Western blot (right panel) assays of the effect of ectopic expression of miR-181a/mIR-191b on the endogenous expression of PBX3. MONOMAC-6 cells served as a representative.

References

    1. He L, Hannon GJ. MicroRNAs: small RNAs with a big role in gene regulation. Nat Rev Genet. 2004;5(7):522–531. - PubMed
    1. Esquela-Kerscher A, Slack FJ. Oncomirs: microRNAs with a role in cancer. Nat Rev Cancer. 2006;6(4):259–269. - PubMed
    1. He L, Thomson JM, Hemann MT, et al. A microRNA polycistron as a potential human oncogene. Nature. 2005;435(7043):828–833. - PMC - PubMed
    1. Chen J, Odenike O, Rowley JD. Leukaemogenesis: more than mutant genes. Nat Rev Cancer. 2010;10(1):23–36. - PMC - PubMed
    1. Marcucci G, Mrozek K, Radmacher MD, Garzon R, Bloomfield CD. The prognostic and functional role of microRNAs in acute myeloid leukemia. Blood. 2011;117(4):1121–1129. - PMC - PubMed

Publication types

MeSH terms

Associated data