. 2012 Mar 29;119(13):3073-83.
doi: 10.1182/blood-2011-07-369736. Epub 2012 Jan 17.

Delineation of antigen-specific and antigen-nonspecific CD8(+) memory T-cell responses after cytokine-based cancer immunotherapy

Affiliations

Delineation of antigen-specific and antigen-nonspecific CD8(+) memory T-cell responses after cytokine-based cancer immunotherapy

Julia K Tietze et al. Blood. .

Abstract

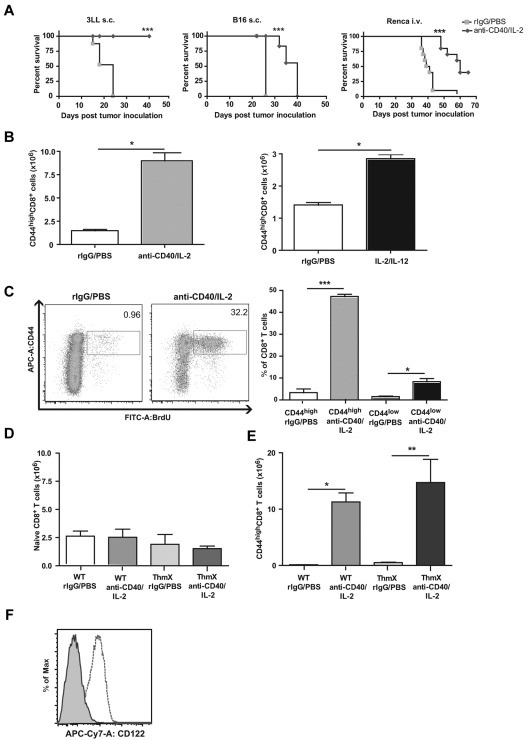
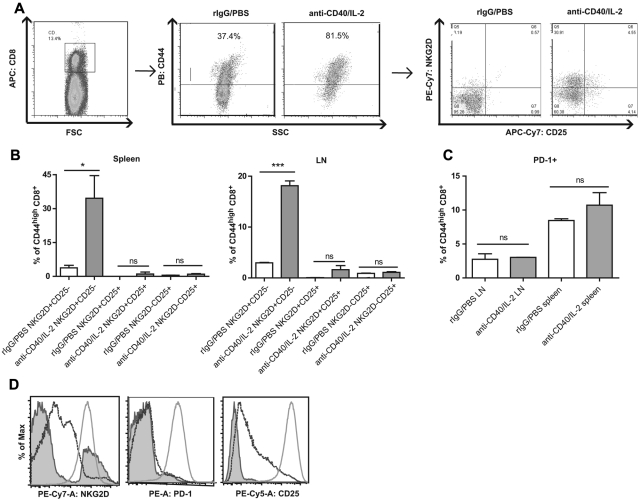
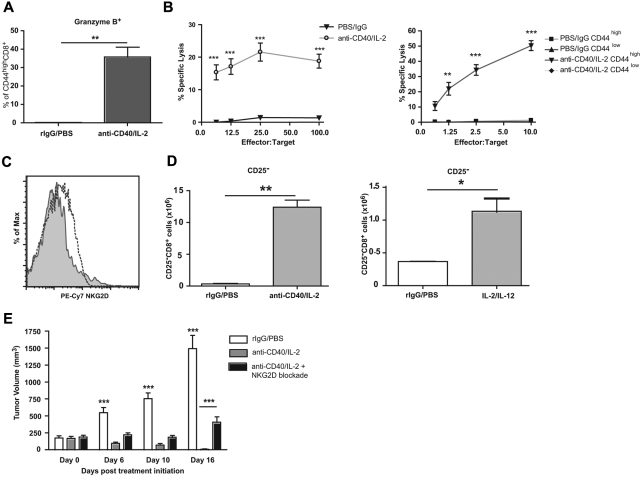
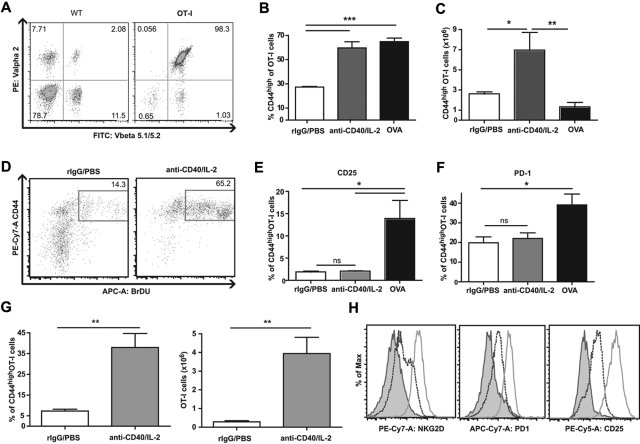
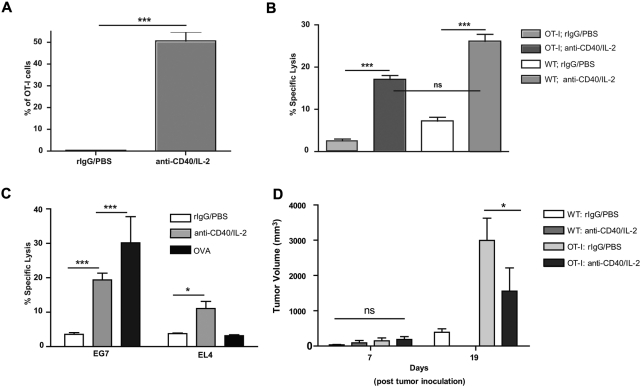
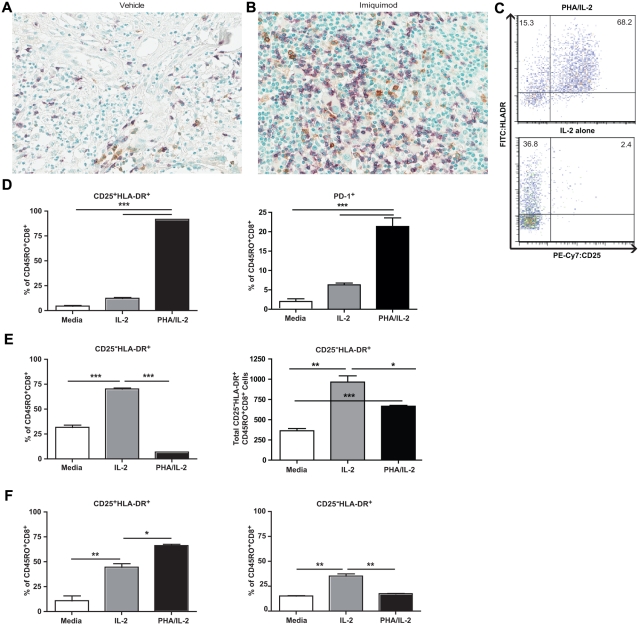
Memory T cells exhibit tremendous antigen specificity within the immune system and accumulate with age. Our studies reveal an antigen-independent expansion of memory, but not naive, CD8(+) T cells after several immunotherapeutic regimens for cancer resulting in a distinctive phenotype. Signaling through T-cell receptors (TCRs) or CD3 in both mouse and human memory CD8(+) T cells markedly up-regulated programmed death-1 (PD-1) and CD25 (IL-2 receptor α chain), and led to antigen-specific tumor cell killing. In contrast, exposure to cytokine alone in vitro or with immunotherapy in vivo did not up-regulate these markers but resulted in expanded memory CD8(+) T cells expressing NKG2D, granzyme B, and possessing broadly lytic capabilities. Blockade of NKG2D in mice also resulted in significantly diminished antitumor effects after immunotherapy. Treatment of TCR-transgenic mice bearing nonantigen expressing tumors with immunotherapy still resulted in significant antitumor effects. Human melanoma tissue biopsies obtained from patients after topically applied immunodulatory treatment resulted in increased numbers of these CD8(+) CD25(-) cells within the tumor site. These findings demonstrate that memory CD8(+) T cells can express differential phenotypes indicative of adaptive or innate effectors based on the nature of the stimuli in a process conserved across species.


Figures

Figure 1
Figure 1
Effects of immunotherapy regimens on memory CD8 T cell expansion and function in vivo. (A) Survival after anti-CD40 and IL-2 treatment of subcutaneously implanted 3LL (left), subcutaneously implanted B16 (middle), or intravenously injected Renca (right) tumor models. (B) Total numbers of splenic CD44highCD8+ T cells on day 11 of anti-CD40 and IL-2 (left) and 5 days after IL-2 and IL-12 (right) immunotherapy regimens in naive mice. (C) BrdU incorporation of CD44highCD8+ T cells in response to immunotherapy. Numbers in dot plots represent percentages of CD8+ T cells. (D) Percentage of naive CD8+ T cells in wildtype and thymectomized mice 11 days after anti-CD40 and IL-2 therapy. (E) Percentage of memory CD8+ T cells in WT and thymectomized mice on day 11 of anti-CD40 and IL-2 treatment. (F) Expression of CD122 on CD44high (dashed line) compared with CD44low CD8+ T cells (shaded) from resting C57BL/6 mice. Data are representative of at least 3 independent experiments (*P < .05, **P < .01, ***P < .001).
Figure 2
Figure 2
Phenotype of cytokine induced CD8+ T cells in vivo and in vitro. (A) Gating schema and expression of NKG2D and CD25 on CD44highCD8+ T cells. (B) Percentages of CD25 and/or NKG2D expressing CD44highCD8+ populations in the spleen (left) and lymph node (right) on day 12 of anti-CD40 and IL-2 treatment. (C) Percentage of PD-1+ CD8+ T cells 12 days after anti-CD40 and IL-2 treatment in the spleen and lymph node. (D) Histograms depicting expression of NKG2D+ (left), PD-1+ (middle), and CD25+ (right) CD8+ T cells after anti-CD3 and anti-CD28 (solid line) or IL-2 (dashed line) stimulation compared with media alone (shaded). Data are representative of at least independent experiments (*P < .05, **P < .01, ***P < .001).
Figure 3
Figure 3
Characterization of functional ability and tumor efficacy of immunotherapy expanded CD8+ T cells. (A) Granzyme B expression in CD44highCD8+ T cells on day 12 of anti-CD40 and IL-2 treatment. (B) Lytic ability of whole splenocytes (left) or sorted CD44high and CD44low CD8+ T cells (right) from anti-CD40 and IL-2 or control treated animals redirected against anti-CD3 labeled P815 targets. (C) NKG2D expression and (D) quantification of CD25 (pos) and (neg) CD8+ T cells from mice bearing orthotopic Renca tumors. (E) Tumor growth after immunotherapy concurrent with blockade of NKG2D in sc NKG2D ligand expressing Renca tumors. Data are representative of at least 3 independent experiments (*P < .05, **P < .01, ***P < .001).
Figure 4
Figure 4
Phenotype of OT-I CD8+ T cells after cytokine immunotherapy versus immunization. (A) Expression of Vα2 and Vβ5.1/5.2 on peripheral blood CD8+ T cells from WT (left) and OT-I (right) mice. Numbers in the quadrants denote the percentages of CD8+ T cells expressing each marker. (B) Percentage and (C) numbers of CD44high expressing OT-I cells 11 days after anti-CD40 and IL-2 immunotherapy or OVA vaccination. (D) Dot plots depicting BrdU incorporation gated by CD44high expressing population in adoptively transferred OT-I cells after immunotherapy. Percentages of (E) CD25 and (F) PD-1 expression on CD44highOT-I cells from anti-CD40/IL-2 or OVA-vaccinated mice. (G) Percentage (left) and total numbers (right) of NKG2D+CD25 of CD44highOT-I cells on day 12 of anti-CD40 and IL-2 treatment. (H) Frequencies of NKG2D (left), PD-1 (middle), and CD25 (right) on OT-I cells after in vitro anti-CD3 and anti-CD28 (solid line) or IL-2 (dashed line) stimulations compared with media alone (shaded). Data are representative of at least 2 independent experiments (*P < .05, **P < .01, ***P < .001).
Figure 5
Figure 5
Functional analysis of OT-I cells after anti-CD40 and IL-2 treatment. (A) Granzyme B expression by OT-I T cells on day 12 day of anti-CD40 and IL-2 treatment. (B) Lytic ability (presented as percentage specific lysis at a 50:1 E/T ratio) of OT-I and WT mice on day 12 of anti-CD40 and IL-2 treatment. (C) Specific lysis of OVA-expressing EG7 and OVA-negative EL4 tumor lines after anti-CD40 and IL-2. Presented as percentage specific lysis at a 25:1 E/T ratio. (D) Growth of subcutaneous 3LL tumors in control and anti-CD40/IL-2-treated OT-I and WT mice compared. Data are representative of at least 2 independent experiments (*P < .05, **P < .01, ***P < .001).
Figure 6
Figure 6
Human CD8 T cells exhibit similar phenotypic characteristics to mice after in vivo and in vitro antigen nonspecific stimulation. CD8 (purple) and CD25 (brown) expression in melanoma lesional biopsies after application of (A) vehicle or (B) 5% imiquimod cream daily for 14 days (40× magnification). (C) Dot plots depict gating schema and expression of HLA-DR and CD25 expression on human CD8+ T cells after 3 days of stimulation with PHA/IL-2 (TCR mimicking) or IL-2 alone in vitro. (D) Percentages of (TCR-dependent) CD25+HLA-DR+ (left) or PD-1+ (right) expressing CD45RO+CD8+ human T cells. (E) Percentage (left) and numbers (right) of CD25HLA-DR+ (TCR-independently activated) human CD45RO+CD8+ T cells. (F) Percentages of CD25+ (left) and CD25 (right) human CD45RO+CD8+ T cells after 14 days of indicated stimulation. Data are representative of at least 2 independent experiments (*P < .05, **P < .01, ***P < .001).

References

    1. Zimmerman C, Brduscha-Riem K, Blaser C, Zinkernagel RM, Pircher H. Visualization, characterization, and turnover of CD8+ memory T cells in virus-infected hosts. J Exp Med. 1996;183(4):1367–1375. - PMC - PubMed
    1. Murali-Krishna K, Altman JD, Suresh M, Sourdive D, Zajac A, Ahmed R. In vivo dynamics of anti-viral CD8 T cell responses to different epitopes. An evaluation of bystander activation in primary and secondary responses to viral infection. Adv Exp Med Biol. 1998;452:123–142. - PubMed
    1. Murali-Krishna K, Altman JD, Suresh M, et al. Counting antigen-specific CD8 T cells: a reevaluation of bystander activation during viral infection. Immunity. 1998;8(2):177–187. - PubMed
    1. Sprent J, Zhang X, Sun S, Tough D. T-cell turnover in vivo and the role of cytokines. Immunol Lett. 1999;65(1-2):21–25. - PubMed
    1. Tough DF, Sprent J. Viruses and T cell turnover: evidence for bystander proliferation. Immunol Rev. 1996;150:129–142. - PubMed

Publication types

MeSH terms