. 2012 Feb;122(2):586-99.
doi: 10.1172/JCI43937. Epub 2012 Jan 17.

Oncogenic β-catenin triggers an inflammatory response that determines the aggressiveness of hepatocellular carcinoma in mice

Affiliations

Oncogenic β-catenin triggers an inflammatory response that determines the aggressiveness of hepatocellular carcinoma in mice

Marie Anson et al. J Clin Invest. 2012 Feb.

Abstract

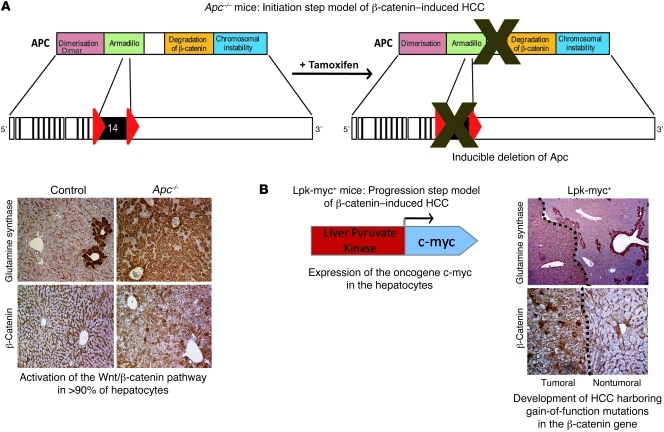
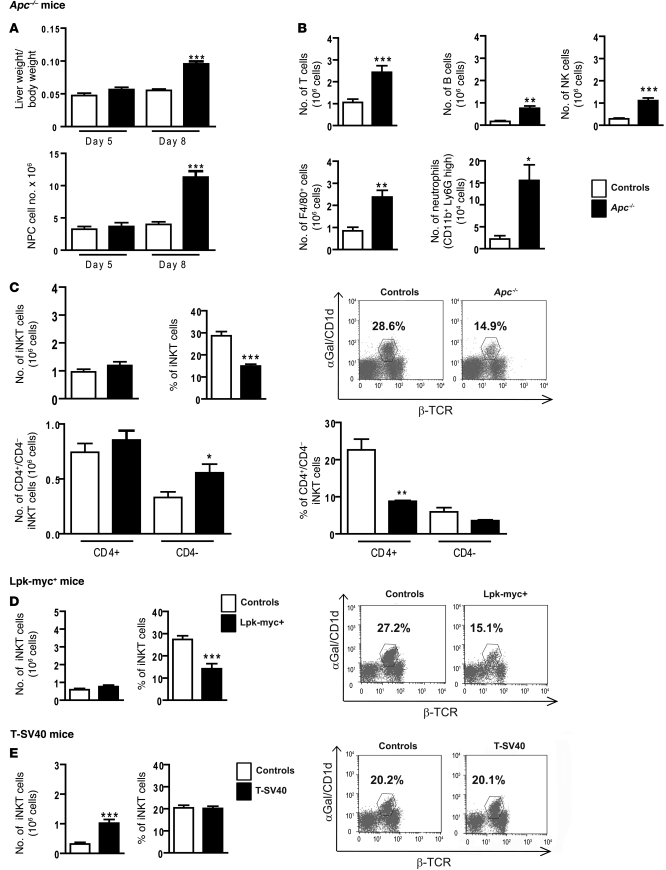
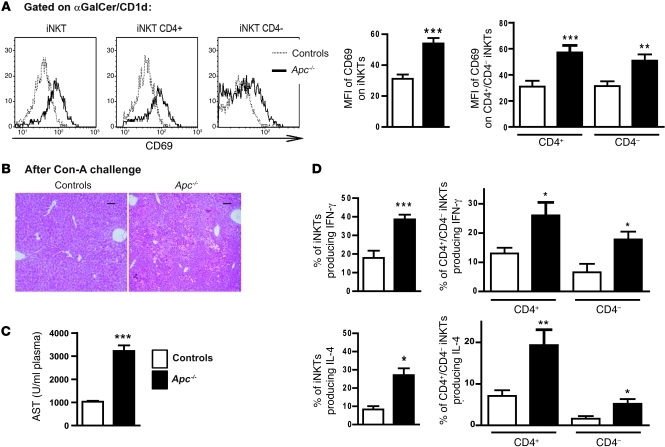
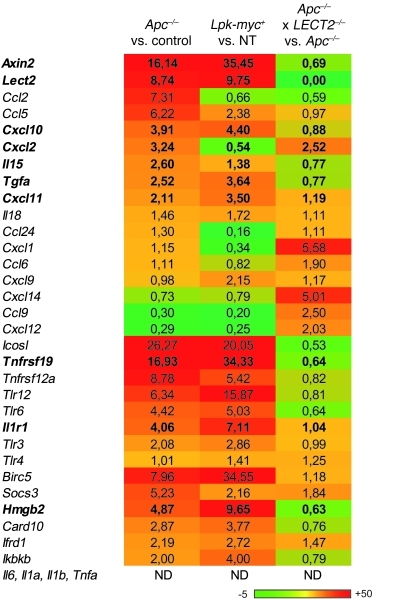
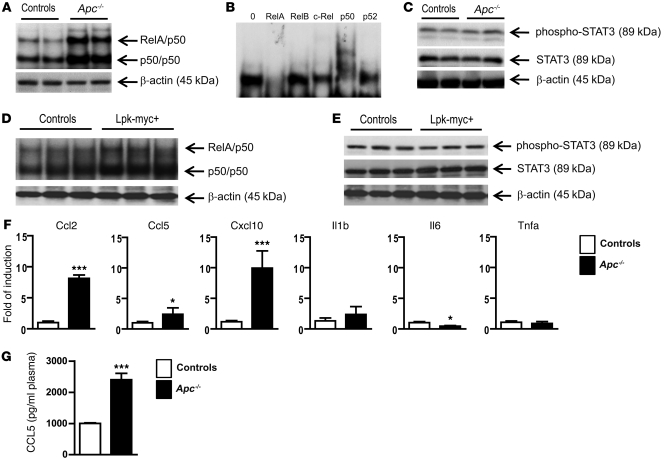
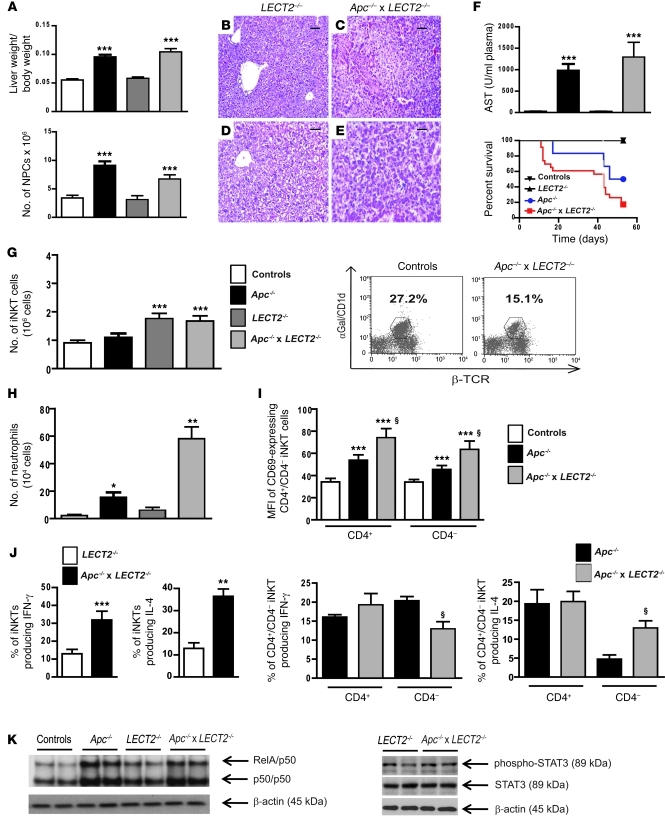
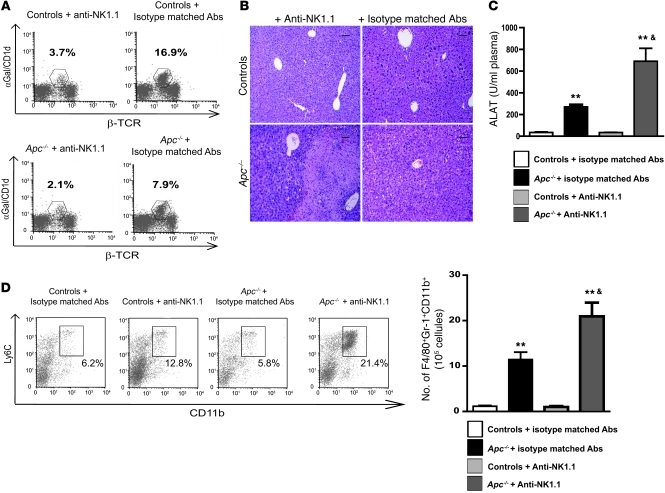
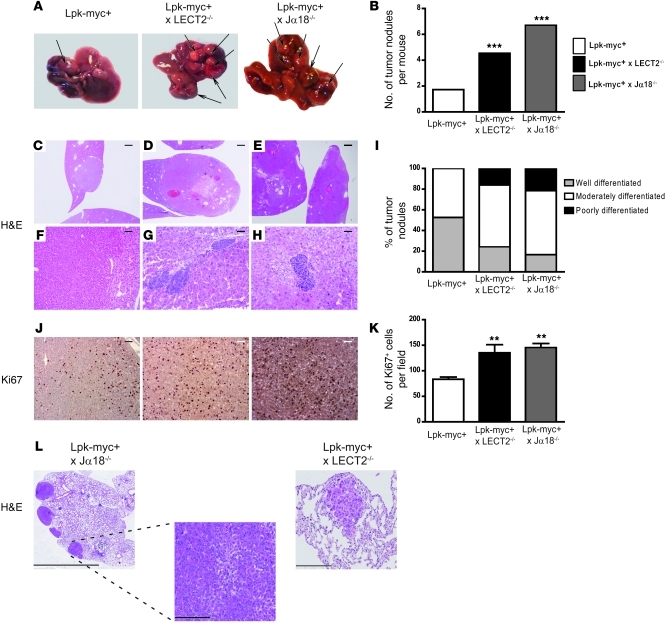
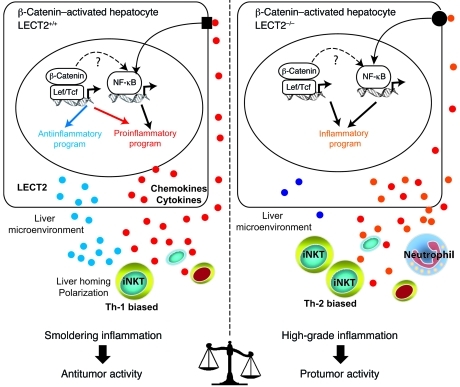
Hepatocellular carcinoma (HCC) is the third leading cause of cancer-related death worldwide. Its pathogenesis is frequently linked to liver inflammation. Gain-of-function mutations in the gene encoding β-catenin are frequent genetic modifications found in human HCCs. Thus, we investigated whether inflammation was a component of β-catenin-induced tumorigenesis using genetically modified mouse models that recapitulated the stages of initiation and progression of this tumoral process. Oncogenic β-catenin signaling was found to induce an inflammatory program in hepatocytes that involved direct transcriptional control by β-catenin and activation of the NF-κB pathway. This led to a specific inflammatory response, the intensity of which determined the degree of tumor aggressiveness. The chemokine-like chemotactic factor leukocyte cell-derived chemotaxin 2 (LECT2) and invariant NKT (iNKT) cells were identified as key interconnected effectors of liver β-catenin-induced inflammation. In genetic deletion models lacking the gene encoding LECT2 or iNKT cells, hepatic β-catenin signaling triggered the formation of highly malignant HCCs with lung metastasis. Thus, our results identify inflammation as a key player in β-catenin-induced liver tumorigenesis. We provide strong evidence that, by activating pro- and antiinflammatory mediators, β-catenin signaling produces an inflammatory microenvironment that has an impact on tumoral development. Our data are consistent with the fact that most β-catenin-activated HCCs are of better prognosis.


Figures

Figure 1
Figure 1. Description of the different genetically modified mouse models harboring oncogenic β-catenin activation in the liver.
(A) Initiation step model of β-catenin–induced HCC. In this previously described model (14, 15), Apc inactivation in nearly all hepatocytes of the liver lobule is induced by tamoxifen injection and is evidenced by glutamine synthetase, cytosolic, and nuclear β-catenin stainings. Apcflox/flox, TTR-Cre-Tam mice are referred to as Apc–/– mice and Apcflox/flox, Cre-negative mice are control mice. (B) Progression step model of β-catenin–induced HCC. In this previously described model (9, 16), expression of the c-myc oncogene is targeted in the hepatocytes under the control of the Lpk gene and leads to the development of HCCs that harbor activated β-catenin mutations (9, 16) and stain positive for glutamine synthetase and nuclear β-catenin.
Figure 2
Figure 2. β-catenin activation in hepatocytes modifies the liver microenvironment and specifically affects iNKT cell recruitment.
(A) The ratio of liver weight/body weight was assessed, and the number of NPCs was evaluated in control and Apc–/– livers at 5 and 8 days after tamoxifen injection. (B) FACS analysis of NPCs was performed to assess the absolute number (Nb) of the various immune cell subpopulations (T cells, B cells, F4/80-positive cells, neutrophils, and NK cells) in Apc–/– and control livers, 8 days after tamoxifen injection. (C) FACS analysis of NPCs from Apc–/– and control livers was performed using α-GalCer/CD1d tetramer expression to assess the number (upper left panel) and proportion (upper right panel) of iNKT cells in the total population and the number (lower left panel) and proportion (lower right panel) of iNKTs expressing or not expressing the CD4 marker. (D) FACS analysis of NPCs was performed using α-GalCer/CD1d tetramer expression to assess the number (left panel) and the proportion (right panel) of iNKT cells in 12-month-old tumoral Lpk-myc+ livers and nontumoral control livers. (E) FACS analysis of NPCs was performed using α-GalCer/CD1d tetramer expression to assess the number (left panel) and the proportion (right panel) of iNKT cells in T-SV40 and control livers. The graphs represent the number or the proportion of cells among CD45+/Ly5+ cells in the liver. Dot plots show representative FACS analysis, and the numbers represent the percentage of iNKTs gated on CD45+Ly5+ cells. All data are representative of 6 independent experiments with 4 mice/group. *P < 0.05; **P < 0.01; ***P < 0.001 (controls vs. Apc–/– or controls vs. Lpk-myc+ or controls vs. T-SV40). Error bars represent SD.
Figure 3
Figure 3. Characterization of iNKT cells in β-catenin–activated livers.
NPCs were collected from livers 8 days after tamoxifen injection. (A) FACS profiles for CD69 expression (left panel) and MFI of CD69 (right panel) in NPCs gated on α-GalCer–loaded CD1d tetramer-positive cells (iNKTs) from Apc–/– and control livers, including those from the CD4+ and CD4 subpopulations. (B) Paraffin-embedded sections obtained from control and Apc–/– livers after ConA challenge were stained with H&E. Scale bars: 50 μm. (C) Levels of AST were measured in the sera of control and Apc–/– mice 12 hours after ConA challenge. (D) Intracellular staining for IFN-γ (top panels) and IL-4 (bottom panels) was performed after in vitro stimulation of NPCs. This analysis was carried out in CD4+ and CD4 α-GalCer/CD1d tetramer-positive cells. The graphs represent the percentage or the number of cells among the CD45+Ly5+ cells in the liver. The histograms are representative FACS analyses. All data are representative of 6 independent experiments with 5 mice/group. *P < 0.05; **P < 0.01; ***P < 0.001 (controls vs. Apc–/–). Error bars represent SD.
Figure 4
Figure 4. Inflammatory program induced in the liver by the oncogenic activation of β-catenin in the hepatocytes.
Expression of different β-catenin target genes related to inflammation was analyzed using predesigned primers and probe sets from Applied Biosystems (Supplemental Table 1). Results are shown using a heat map visualization in which columns represent the different liver mouse samples studied and rows represent the various genes. Genes expressed at low levels are in green; those expressed at high levels are in red. ND, not detectable. Each group was composed of 4 mice.
Figure 5
Figure 5. β-catenin activation in hepatocytes triggers an intrinsic inflammatory program associated with the activation of NF-κB.
(AE) NF-κB activation (A) in liver nuclear extracts from Apc–/– and control livers was monitored by EMSA analysis. Supershift analysis (B) was performed to determine which NF-κB subunit was involved in Apc–/– livers. Immunoblotting was used to detect phospho-STAT3, STAT3, and β-actin (C) in protein lysates from Apc–/– and control livers. NF-κB activation (D) in liver nuclear extracts from Lpk-myc+ and control livers was monitored by EMSA analysis. (E) Immunoblotting was used to detect phospho-STAT3, STAT3, and β-actin in protein lysates from Lpk-myc+ and control livers. (F) mRNAs were extracted from NPCs and analyzed by real-time qPCR using specific primers. (G) Sera from Apc–/– and control mice were collected and CCL5 plasma levels were evaluated using Luminex technology (Bio-Rad). All data with statistical analysis are representative of 4 experiments with 4 mice/group. *P < 0.05; ***P < 0.001 (controls versus Apc–/–). Error bars represent SD.
Figure 6
Figure 6. LECT2 has a critical role in shaping the inflammatory environment in β-catenin–activated liver.
(A) The ratio of liver/body weights and the number of NPCs were evaluated in controls, Apc–/–, LECT2–/–, and Apc–/– × LECT2–/– livers 8 days after tamoxifen injection. (BE) Paraffin-embedded livers sections from the same group of mice were stained with H&E. Scale bars: 100 μm (B and C); 60 μm (D and E). (F) Serum AST levels (upper panel) and Survival curves (lower panel) were assessed in the same conditions. (G) FACS analysis of NPCs using α-GalCer–loaded CD1d tetramers and anti-TCR β chain staining to assess the number (left panel) and proportion (right panel) of iNKT cells in the livers of the same mice groups. (H) FACS analysis of NPCs using anti-Ly6G staining to assess the number of neutrophils. (I) MFI of CD69+ cells in NPCs gated on iNKTs. (J) Intracellular staining for IFN-γ and IL-4 were performed after in vitro stimulation for total (left panel) and CD4+ or CD4 iNKTs (right panel). (K) Nuclear NF-κB activation from LECT2–/– and Apc–/– × LECT2–/– livers was monitored by EMSA. Immunoblotting of phospho-STAT3, STAT3, and β-actin on protein lysates. All data with statistical analysis are representative of 4 experiments with 5 mice/group. *P < 0.05; **P < 0.01; ***P < 0.001 (controls versus Apc–/– or LECT2–/– versus Apc–/–LECT2–/–); §P < 0.03 (Apc–/– versus Apc–/– × LECT2–/–). Error bars represent SD.
Figure 7
Figure 7. iNKTs display antiinflammatory properties during β-catenin–induced liver inflammation.
(A) FACS analysis of NPCs was performed to assess iNKT cell depletion in controls and Apc–/– livers after treatment with anti-NK1.1 or isotype-matched irrelevant antibodies 8 days after tamoxifen injection. (B) Paraffin-embedded sections obtained from controls and Apc–/– livers after treatment with anti-NK1.1 or isotype-matched irrelevant antibodies were stained with H&E. Scale bars: 50 μm. (C) Serum transaminase levels (ALAT) were measured in controls and Apc–/– mice after treatment with anti-NK1.1 or isotype-matched antibodies. (D) The sub-populations of F4/80+CD11b+Ly6C+ immature macrophages were quantified in the livers of Apc–/– and control mice treated with either anti-NK1.1 or isotype-matched irrelevant 8 days after tamoxifen injection. Dot plots show representative FACS analyses of immature macrophages, gated on F4/80+ cells. The numbers indicate the percentage of these cells among the F4/80+ cells. All data are representative of 3 independent experiments with 4 mice/group. **P < 0.01 (controls vs. Apc–/–); &P < 0.01 (Apc–/– + isotype-matched Abs versus Apc–/– + anti-NK1.1 Abs).
Figure 8
Figure 8. iNKTs and LECT2 are critical cellular and molecular players controlling tumoral progression of β-catenin–dependent liver tumorigenesis.
(A) 12-month-old Lpk-myc+ (n = 12) and Lpk-myc+LECT2–/– (n = 11) or Lpk-myc+Jα18–/– (n = 7) mice were sacrificed, and the number of tumor nodules was evaluated (arrows). (B) The graph represents the mean number of tumors for each group of mice. (CH) Paraffin-embedded sections obtained from Lpk-myc+, Lpk-myc+LECT2–/–, and Lpk-myc+Jα18–/– livers were stained with H&E, and the grade of differentiation for each tumor nodule was assessed. Scale bars: 1 mm (CE); 120 μm (F); 60 μm (G and H). (I) The graph shows the mean number of tumors for each group of mice, according to their degree of differentiation. (J) Immunohistochemistry of Ki67 expression was performed on paraffin-embedded sections obtained from Lpk-myc+ and Lpk-myc+LECT2–/– or Lpk-myc+Jα18–/– livers to evaluate the proliferation rate of the tumor nodules. Scale bars: 50 μm. (K) The graph represents the mean number of Ki67+ cells for each group of mice. (L) Paraffin-embedded sections obtained from Lpk-myc+, Lpk-myc+LECT2–/–, and Lpk-myc+Jα18–/– lungs were stained with H&E. Scale bars: 4 mm (left); 200 μm (middle, right).
Figure 9
Figure 9. Liver inflammation is critical for β-catenin–induced liver tumorigenesis.
Oncogenic activation of β-catenin in hepatocytes triggers an intrinsic inflammatory program with both pro- and antiinflammatory mediators that together construct an inflammatory microenvironment that controls tumor progression. In Apc-deficient (Apc–/–) hepatocytes, β-catenin signaling is constitutively activated and induced: (a) the expression of a proinflammatory program resulting from both a direct control by the Wnt/β-catenin signaling and an indirect control by NF-κB that is not yet understood and (b) the expression of an antiinflammatory program including at least the direct LECT2 target gene. 2 interconnected factors relay the antiinflammatory response, the chemokine-like factor LECT2 and the iNKT cells. iNKT cell homeostasis is controlled by LECT2 at the level of liver homing and cytokine polarization. Together, the β-catenin–induced liver microenvironment exhibits a low grade of chronic inflammation that preserves an immune response with antitumor activity. In mice deficient in Apc and LECT2 (Apc–/–LECT2–/–), the lack of LECT2 causes high-grade inflammation in the liver microenvironment, which strongly potentiates the tumoral process and results in lung metastases (see Results).

References

    1. de Visser KE, Coussens LM. The inflammatory tumor microenvironment and its impact on cancer development. Contrib Microbiol. 2006;13:118–137. - PubMed
    1. Mantovani A, Allavena P, Sica A, Balkwill F. Cancer-related inflammation. Nature. 2008;454(7203):436–444. - PubMed
    1. Grivennikov SI, Greten FR, Karin M. Immunity, inflammation, and cancer. Cell. 2010;140(6):883–899. doi: 10.1016/j.cell.2010.01.025. - DOI - PMC - PubMed
    1. Grivennikov SI, Karin M. Dangerous liaisons: STAT3 and NF-kappaB collaboration and crosstalk in cancer. Cytokine Growth Factor Rev. 2010;21(1):11–19. doi: 10.1016/j.cytogfr.2009.11.005. - DOI - PMC - PubMed
    1. El-Serag HB, Rudolph KL. Hepatocellular carcinoma: epidemiology and molecular carcinogenesis. Gastroenterology. 2007;132(7):2557–2576. doi: 10.1053/j.gastro.2007.04.061. - DOI - PubMed

Publication types

MeSH terms