

Growth differences between North American and European children at risk for type 1 diabetes
- PMID: 22251851
- PMCID: PMC3335929
- DOI: 10.1111/j.1399-5448.2011.00840.x
Growth differences between North American and European children at risk for type 1 diabetes
Abstract
Aim: To evaluate the relationships between early growth and regional variations in type 1 diabetes (T1D) incidence in an international cohort of children with familial and genetic risk for T1D.
Methods: Anthropometric indices between birth to 5 yr of age were compared among regions and T1D proband in 2160 children participating in the Trial to Reduce Insulin-dependent diabetes mellitus in the Genetically at Risk study.
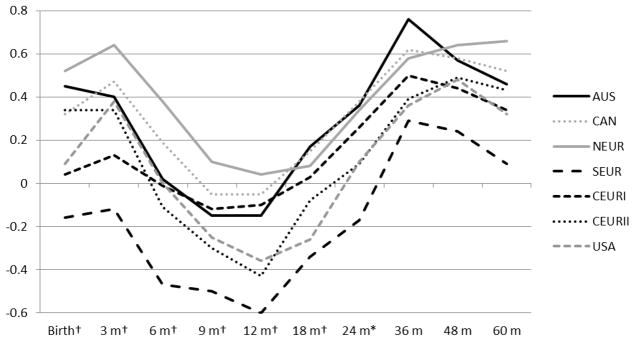
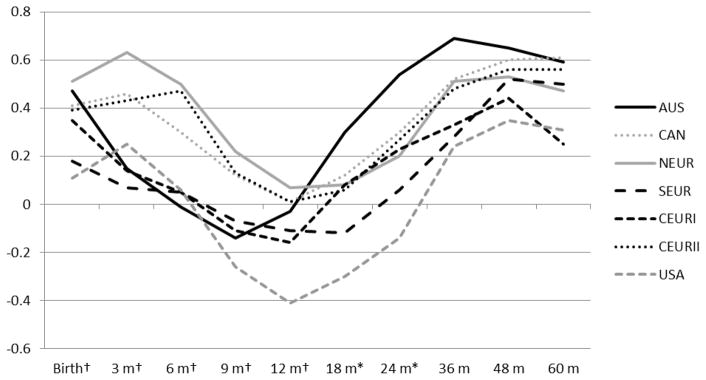
Results: Children in Northern Europe had the highest weight z-score between birth to 12 months of age, while those in Southern Europe and U.S.A. had the lowest weight and length/height z-scores at most time points (p < 0.005 to p < 0.001). Few differences in z-score values for weight, height, and body mass index were found by maternal T1D status. Using International Obesity Task Force criteria, the obesity rates generally increased with age and at 5 yr were highest in males in Northern Europe (6.0%) and in females in Canada (12.8%). However, no statistically significance difference was found by geographic region. In Canada, the obesity rate for female children of mothers with and without T1D differed significantly at 4 and 5 yr (6.0 vs. 0.0% and 21.3 vs. 1.9%, respectively; p < 0.0125) but no differences by maternal T1D status were found in other regions.
Conclusions: There are regional differences in early childhood growth that are consistent with the higher incidence of T1D in Northern Europe and Canada as compared to Southern Europe. Our prospective study from birth will allow evaluation of relationships between growth and the emerging development of autoimmunity and progression to T1D by region in this at-risk population of children.
© 2012 John Wiley & Sons A/S.
Figures


References
-
- Patterson CC, Dahlquist GG, Gyurus E, Green A, Soltesz G EURODIAB Study Group. Incidence trends for childhood type 1diabetes in Europe during 1989–2003 and predicted new cases 2005–20: a multicentre prospective registration study. Lancet. 2009;373:2027–2033. - PubMed
-
- Virtanen SM, Knip M. Nutritional risk predictors of beta-cell autoimmunity and Type 1 diabetes at a young age. Am J Clin Nutr. 2003;78:1053–1067. - PubMed
-
- Wilkin TJ. The accelerator hypothesis: weight gain as the missing link between Type I and Type II diabetes. Diabetologia. 2001;44:914–922. - PubMed
-
- Kibirige M, Metcalf B, Renuka R, Wilkin TJ. Testing the accelerator hypothesis: The relationship between body mass and age at diagnosis of type 1 diabetes. Diabetes Care. 2003;26:2865–2870. - PubMed
-
- Palmer JP, Helquist S, Spinas GA, et al. Interaction of beta-cell activity and IL-1 concentration and exposure time in isolated rat islets of Langerhans. Diabetes. 1989;38:1211–1216. - PubMed
Publication types
MeSH terms
Grants and funding
LinkOut - more resources
Full Text Sources
Medical
