. 2012 Jan 17:12:22.
doi: 10.1186/1471-2407-12-22.

RNA expression patterns in serum microvesicles from patients with glioblastoma multiforme and controls

Affiliations

RNA expression patterns in serum microvesicles from patients with glioblastoma multiforme and controls

Mikkel Noerholm et al. BMC Cancer. .

Abstract

Background: RNA from exosomes and other microvesicles contain transcripts of tumour origin. In this study we sought to identify biomarkers of glioblastoma multiforme in microvesicle RNA from serum of affected patients.

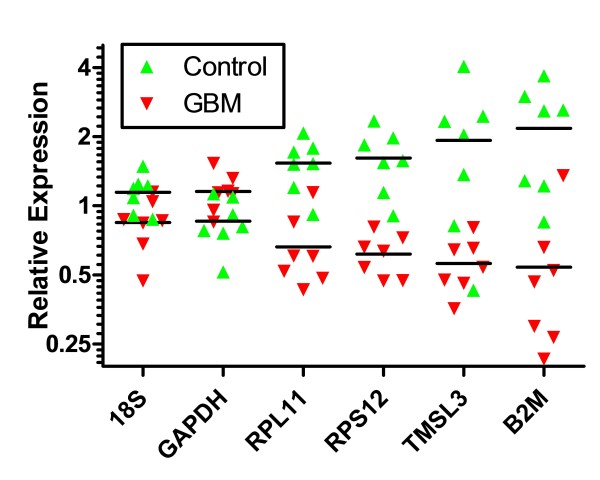
Methods: Microvesicle RNA from serum from patients with de-novo primary glioblastoma multiforme (N = 9) and normal controls (N = 7) were analyzed by microarray analysis. Samples were collected according to protocols approved by the Institutional Review Board. Differential expressions were validated by qRT-PCR in a separate set of samples (N = 10 in both groups).

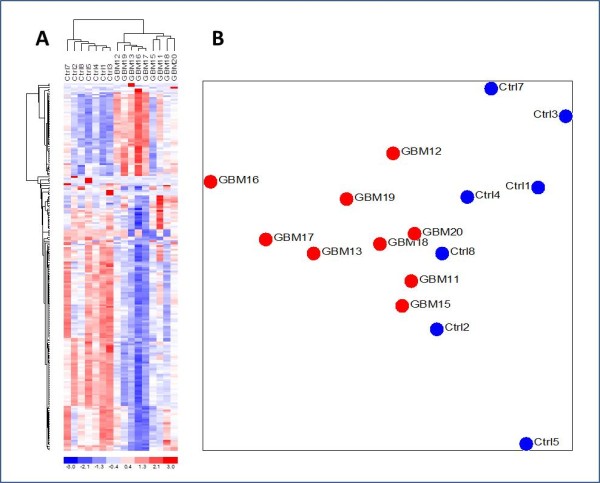
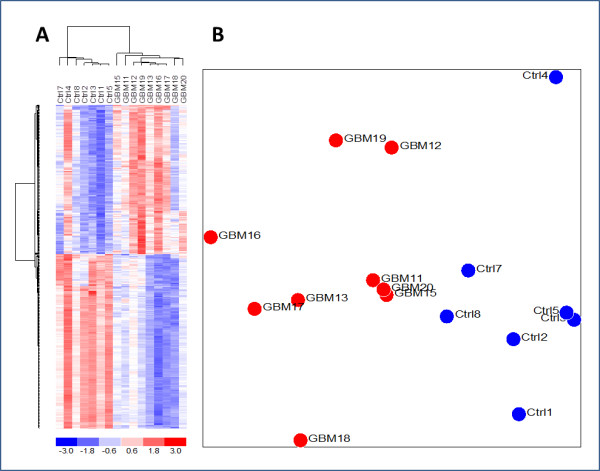
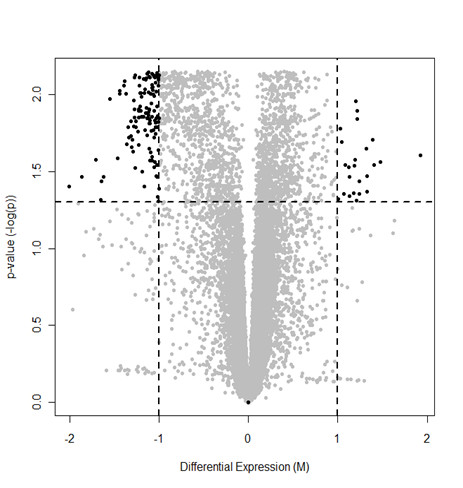
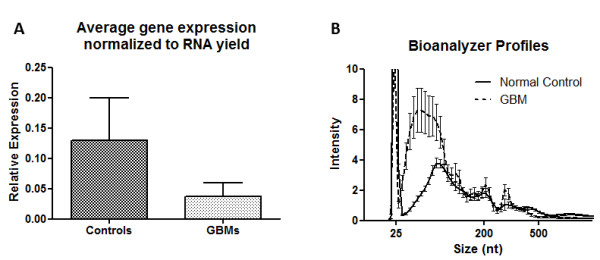
Results: Expression profiles of microvesicle RNA correctly separated individuals in two groups by unsupervised clustering. The most significant differences pertained to down-regulated genes (121 genes > 2-fold down) in the glioblastoma multiforme patient microvesicle RNA, validated by qRT-PCR on several genes. Overall, yields of microvesicle RNA from patients was higher than from normal controls, but the additional RNA was primarily of size < 500 nt. Gene ontology of the down-regulated genes indicated these are coding for ribosomal proteins and genes related to ribosome production.

Conclusions: Serum microvesicle RNA from patients with glioblastoma multiforme has significantly down-regulated levels of RNAs coding for ribosome production, compared to normal healthy controls, but a large overabundance of RNA of unknown origin with size < 500 nt.


Figures

Figure 1
Figure 1
A total of 206 genes were selected without application of t-test by filtering for high signal intensity (> 6 in 30% of samples) and high variation between samples (stdev > 0.8 across all 16 samples). A) A heat map and dendrogram showing perfect unsupervised clustering of the samples based on these 206 genes. B) Principal Component Analysis (PCA) of the same 206 genes as in A.
Figure 2
Figure 2
Analysis of the 400 most dysregulated genes. The 200 most down- and up-regulated genes, respectively, with p < 0.05 in all three normalizations after correction for False Discovery Rate were used (see Additional file 2: Table S1 and Table S2). A) Cluster analysis, B) PCA plot.
Figure 3
Figure 3
Volcano plot of the False Discovery Rate (FDR) corrected p-values from a t-test between the two sample groups after background subtraction and quartile normalization. Genes above the horizontal dashed line have p < 0.05 after FDR correction. It is evident that substantially more genes are significantly down-regulated (121 genes in upper left corner, > 2-fold) than up-regulated (24 genes in upper right corner, > 2-fold).
Figure 4
Figure 4
Validation by qRT-PCR of down-regulated genes. Gene expression levels were normalized to the combined expression of GAPDH and 18S. Lines represent median values for the GBM and control samples, respectively.
Figure 5
Figure 5
Serum microvesicle RNA from patients with glioblastoma multiforme has an overabundance of RNA with size <500 nt. (A) Gene expression relative to the amount of microvesicle RNA present in serum of GBM patients and normal healthy controls. Bars represent the average expression of 16 genes as measured by qRT-PCR, normalized to the amount of exoRNA isolated from 1 mL of serum. The yield from GBM samples is higher than from controls, but this does not result in higher gene expression. (B) From the Bioanalyzer profiles it appears that the extra RNA in GBM serum is predominantly <300 nt. The plot is showing the mean ± SEM (N = 10 GBM and 10 controls). The non-visible parts of the profiles (>500 nt) were very similar for GBM and controls

References

    1. Dean BL, Drayer BP, Bird CR, Flom RA, Hodak JA, Coons SW, Carey RG. Gliomas: classification with MR imaging. Radiology. 1990;174:411–415. - PubMed
    1. Hartmann C, Hentschel B, Tatagiba M, Schramm J, Schnell O, Seidel C, Stein R, Reifenberger G, Pietsch T, von Deimling A. et al.Molecular Markers in Low-Grade Gliomas: Predictive or Prognostic? Clin Cancer Res. 2011;17:4588–4599. doi: 10.1158/1078-0432.CCR-10-3194. - DOI - PubMed
    1. Kreth S, Thon N, Eigenbrod S, Lutz J, Ledderose C, Egensperger R, Tonn JC, Kretzschmar HA, Hinske LC, Kreth FW. O-methylguanine-DNA methyltransferase (MGMT) mRNA expression predicts outcome in malignant glioma independent of MGMT promoter methylation. PLoS One. 2011;6:e17156. doi: 10.1371/journal.pone.0017156. - DOI - PMC - PubMed
    1. Cancer Genome Atlas Research Network. Comprehensive genomic characterization defines human glioblastoma genes and core pathways. Nature. 2008;455:1061–1068. doi: 10.1038/nature07385. - DOI - PMC - PubMed
    1. Sharma P, Sahni NS, Tibshirani R, Skaane P, Urdal P, Berghagen H, Jensen M, Kristiansen L, Moen C, Sharma P. et al.Early detection of breast cancer based on gene-expression patterns in peripheral blood cells. Breast Cancer Res. 2005;7:R634–R644. doi: 10.1186/bcr1203. - DOI - PMC - PubMed

Publication types