CX3CR1 deficiency does not influence trafficking of adipose tissue macrophages in mice with diet-induced obesity
- PMID: 22252034
- PMCID: PMC4006981
- DOI: 10.1038/oby.2012.7
CX3CR1 deficiency does not influence trafficking of adipose tissue macrophages in mice with diet-induced obesity
Abstract
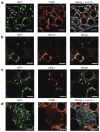
Adipose tissue macrophages (ATMs) accumulate in fat during obesity and resemble foam cells in atherosclerotic lesions, suggesting that common mechanisms underlie both inflammatory conditions. CX(3)CR1 and its ligand fractalkine/CX(3)CL1 contribute to macrophage recruitment and inflammation in atherosclerosis, but their role in obesity-induced adipose tissue inflammation is unknown. Therefore, we tested the hypothesis that CX(3)CR1 regulates ATM trafficking to epididymal fat and contributes to the development of adipose tissue inflammation during diet-induced obesity. Cx(3)cl1 and Cx(3)cr1 expression was induced specifically in epididymal fat from mice fed a high-fat diet (HFD). CX(3)CR1 was detected on multiple myeloid cells within epididymal fat from obese mice. To test the requirement of CX(3)CR1 for ATM trafficking and obesity-induced inflammation, Cx(3)cr1(+/GFP) and Cx(3)cr1(GFP/GFP) mice were fed a HFD. Ly-6c(Low) monocytes were reduced in lean Cx(3)cr1(GFP/GFP) mice; however, HFD-induced monocytosis was comparable between strains. Total ATM content, the ratio of type 1 (CD11c(+)) to type 2 (CD206(+)) ATMs, expression of inflammatory markers, and T-cell content were similar in epididymal fat from obese Cx(3)cr1(+/GFP) and Cx(3)cr1(GFP/GFP) mice. Cx(3)cr1 deficiency did not prevent the development of obesity-induced insulin resistance or hepatic steatosis. In summary, our data indicate that CX(3)CR1 is not required for the recruitment or retention of ATMs in epididymal adipose tissue of mice with HFD-induced obesity even though CX(3)CR1 promotes foam cell formation. This highlights an important point of divergence between the mechanisms regulating monocyte trafficking to fat with obesity and those that contribute to foam cell formation in atherogenesis.
Conflict of interest statement
The authors declared no conflict of interest.
Figures


Similar articles
-
CX3CR1 is required for monocyte homeostasis and atherogenesis by promoting cell survival.Blood. 2009 Jan 22;113(4):963-72. doi: 10.1182/blood-2008-07-170787. Epub 2008 Oct 29. Blood. 2009. PMID: 18971423
-
Role of CX3CR1 receptor in monocyte/macrophage driven neovascularization.PLoS One. 2013;8(2):e57230. doi: 10.1371/journal.pone.0057230. Epub 2013 Feb 21. PLoS One. 2013. PMID: 23437346 Free PMC article.
-
TREM2 regulates obesity-induced insulin resistance via adipose tissue remodeling in mice of high-fat feeding.J Transl Med. 2019 Sep 2;17(1):300. doi: 10.1186/s12967-019-2050-9. J Transl Med. 2019. PMID: 31477129 Free PMC article.
-
Cellular and molecular players in adipose tissue inflammation in the development of obesity-induced insulin resistance.Biochim Biophys Acta. 2014 Mar;1842(3):446-62. doi: 10.1016/j.bbadis.2013.05.017. Epub 2013 May 22. Biochim Biophys Acta. 2014. PMID: 23707515 Free PMC article. Review.
-
Adipose tissue macrophage heterogeneity in the single-cell genomics era.Mol Cells. 2024 Feb;47(2):100031. doi: 10.1016/j.mocell.2024.100031. Epub 2024 Feb 13. Mol Cells. 2024. PMID: 38354858 Free PMC article. Review.
Cited by
-
Adipose tissue macrophages function as antigen-presenting cells and regulate adipose tissue CD4+ T cells in mice.Diabetes. 2013 Aug;62(8):2762-72. doi: 10.2337/db12-1404. Epub 2013 Mar 14. Diabetes. 2013. PMID: 23493569 Free PMC article.
-
CXCR3 modulates obesity-induced visceral adipose inflammation and systemic insulin resistance.Obesity (Silver Spring). 2014 May;22(5):1264-74. doi: 10.1002/oby.20642. Epub 2014 Mar 27. Obesity (Silver Spring). 2014. PMID: 24124129 Free PMC article.
-
Diet-induced obesity promotes myelopoiesis in hematopoietic stem cells.Mol Metab. 2014 Jul 10;3(6):664-75. doi: 10.1016/j.molmet.2014.06.005. eCollection 2014 Sep. Mol Metab. 2014. PMID: 25161889 Free PMC article.
-
Arthroscopic Implantation of Adipose-Derived Stromal Vascular Fraction Improves Cartilage Regeneration and Pain Relief in Patients With Knee Osteoarthritis.Arthrosc Sports Med Rehabil. 2023 May 12;5(3):e707-e716. doi: 10.1016/j.asmr.2023.03.013. eCollection 2023 Jun. Arthrosc Sports Med Rehabil. 2023. PMID: 37388866 Free PMC article.
-
Circulating classical monocytes are associated with CD11c+ macrophages in human visceral adipose tissue.Sci Rep. 2017 Feb 15;7:42665. doi: 10.1038/srep42665. Sci Rep. 2017. PMID: 28198418 Free PMC article.
References
-
- Hotamisligil GS. Inflammation and metabolic disorders. Nature. 2006;444:860–867. - PubMed
-
- Olefsky JM, Glass CK. Macrophages, inflammation, and insulin resistance. Annu Rev Physiol. 2010;72:219–246. - PubMed
-
- Zeyda M, Farmer D, Todoric J, et al. Human adipose tissue macrophages are of an anti-inflammatory phenotype but capable of excessive proinflammatory mediator production. Int J Obes (Lond) 2007;31:1420–1428. - PubMed
Publication types
MeSH terms
Substances
Grants and funding
LinkOut - more resources
Full Text Sources
Medical
Molecular Biology Databases
Research Materials
Miscellaneous

