. 2012 Feb 7;57(3):785-808.
doi: 10.1088/0031-9155/57/3/785. Epub 2012 Jan 18.

A three-dimensional model of an ultrasound contrast agent gas bubble and its mechanical effects on microvessels

Affiliations

A three-dimensional model of an ultrasound contrast agent gas bubble and its mechanical effects on microvessels

N Hosseinkhah et al. Phys Med Biol. .

Abstract

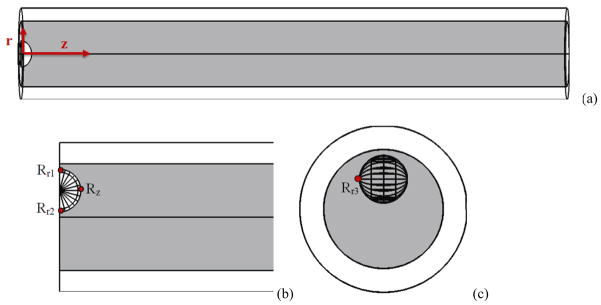
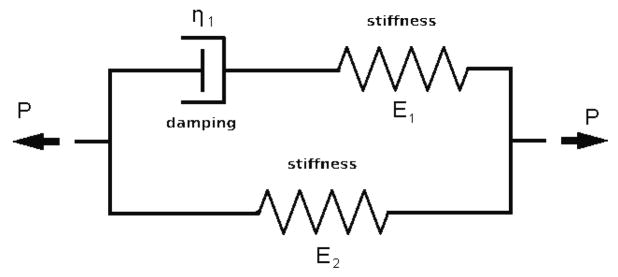
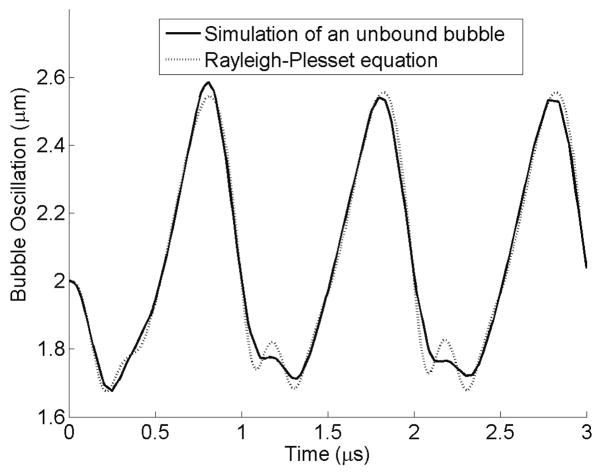
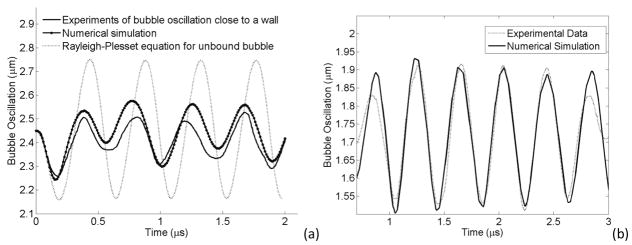
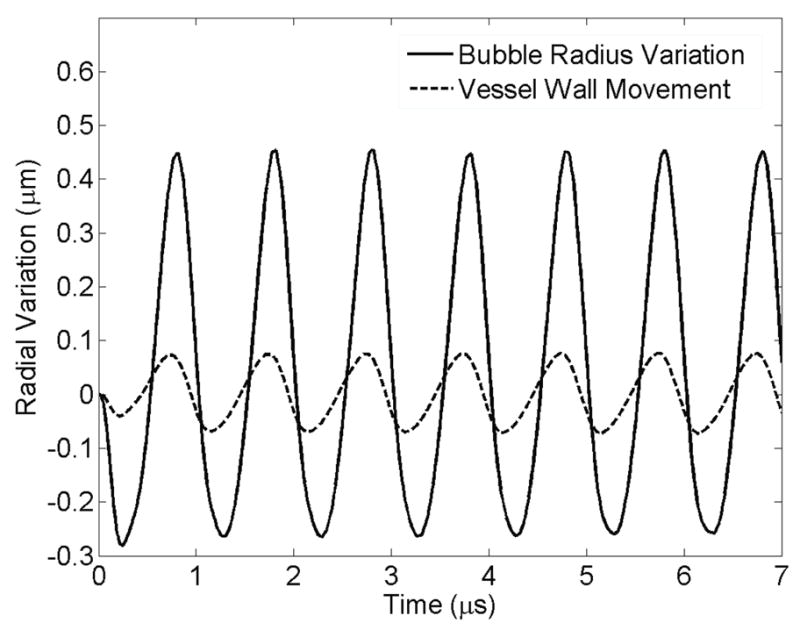
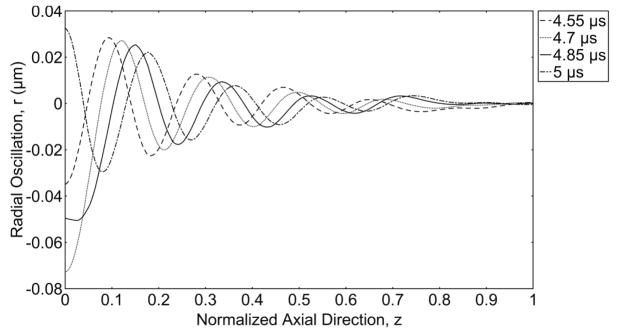
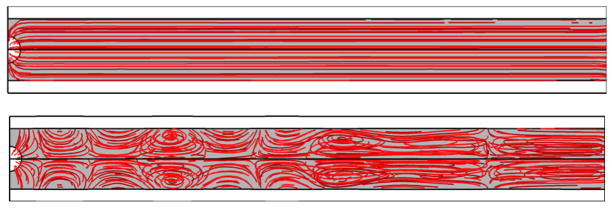
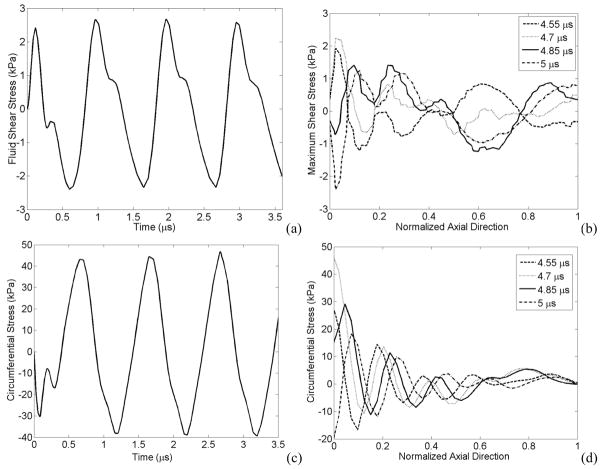
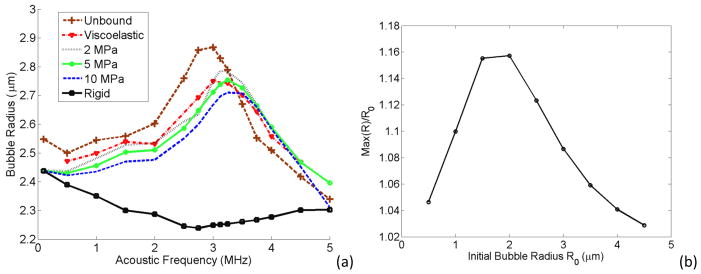
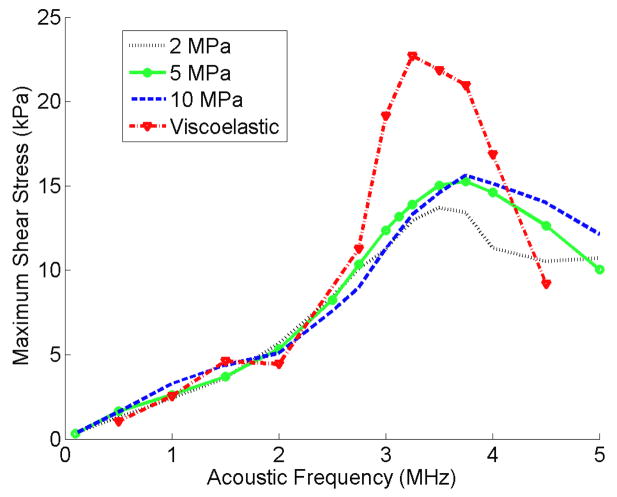
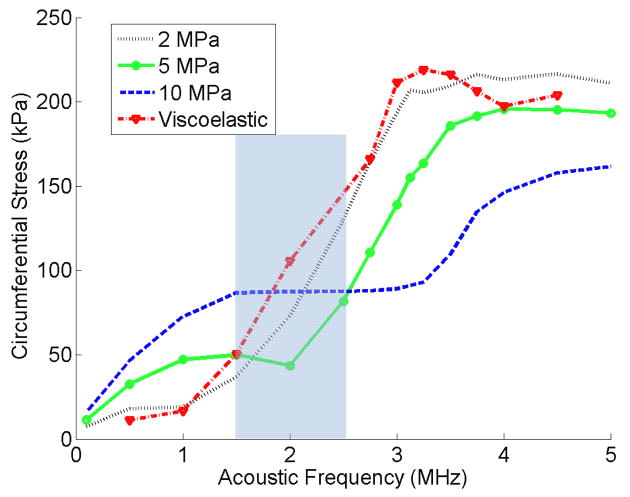
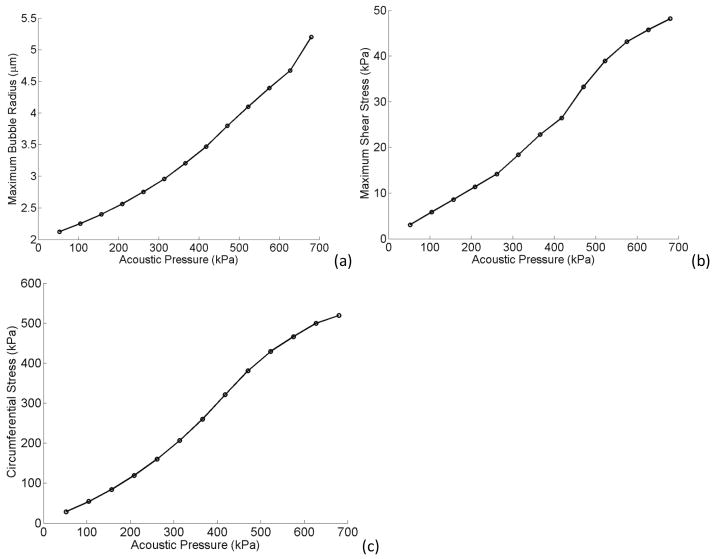
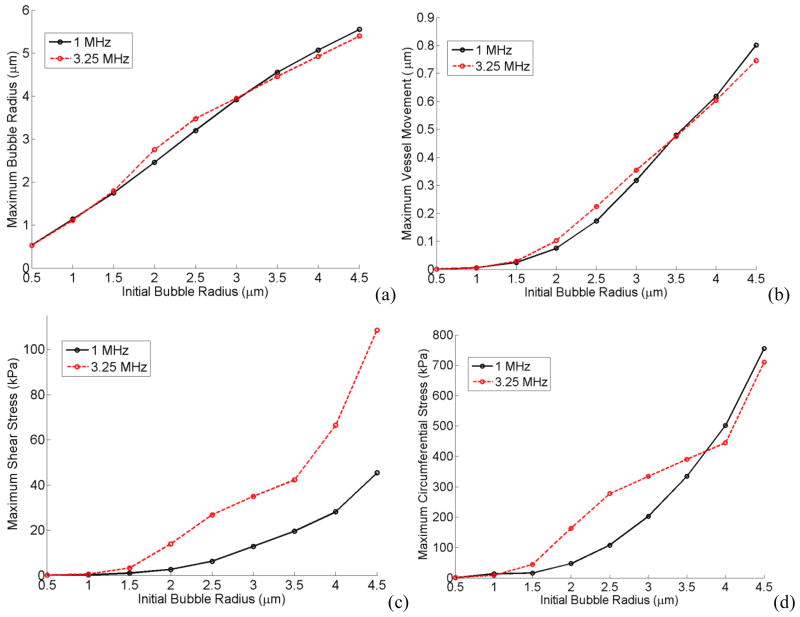
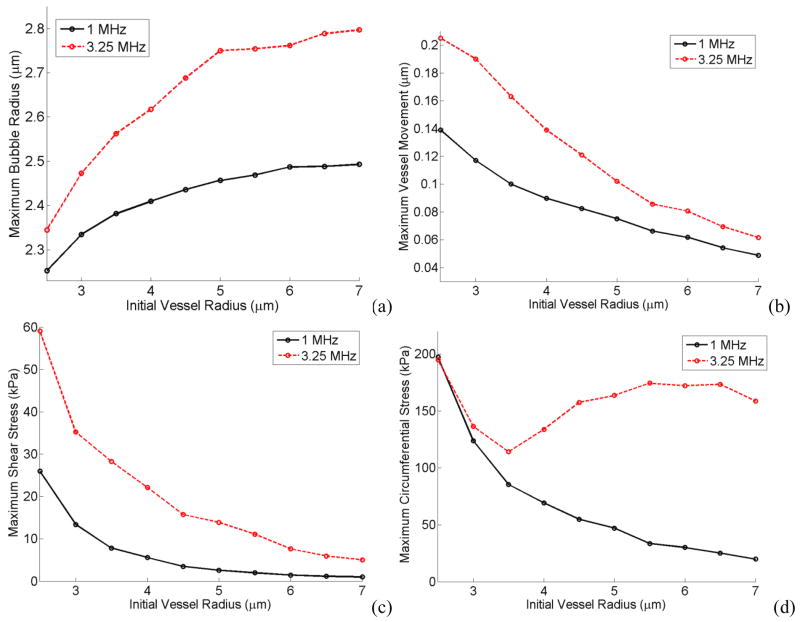
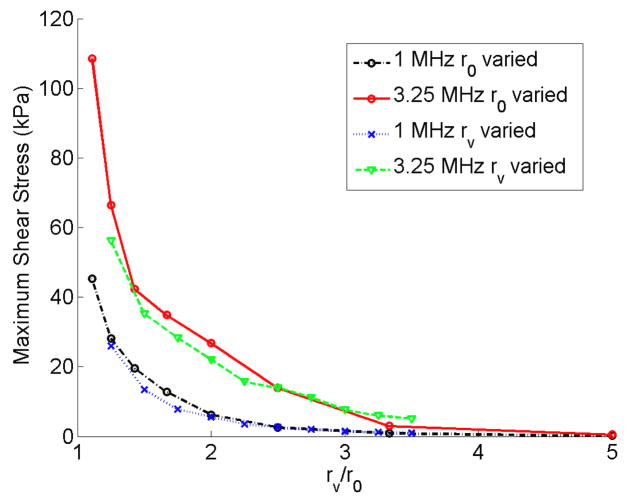
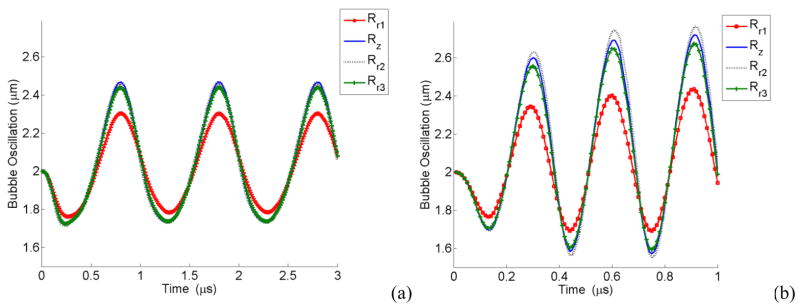
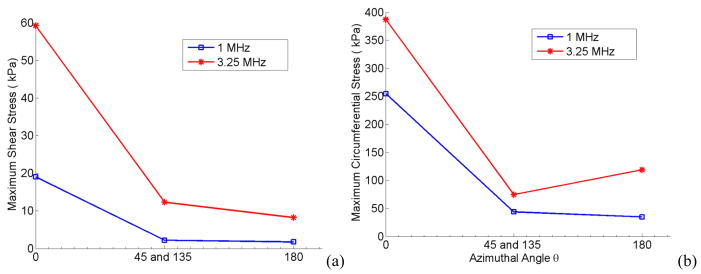
Ultrasound contrast agents inside a microvessel, when driven by ultrasound, oscillate and induce mechanical stresses on the vessel wall. These mechanical stresses can produce beneficial therapeutic effects but also induce vessel rupture if the stresses are too high. Therefore, it is important to use sufficiently low pressure amplitudes to avoid rupturing the vessels while still inducing the desired therapeutic effects. In this work, we developed a comprehensive three-dimensional model of a confined microbubble inside a vessel while considering the bubble shell properties, blood viscosity, vessel wall curvature and the mechanical properties of the vessel wall. Two bubble models with the assumption of a spherical symmetric bubble and a simple asymmetrical bubble were simulated. This work was validated with previous experimental results and enabled us to evaluate the microbubbles' behaviour and the resulting mechanical stresses induced on the vessel walls. In this study, the fluid shear and circumferential stresses were evaluated as indicators of the mechanical stresses. The effects of acoustical parameters, vessel viscoelasticity and rigidity, vessel/bubble size and off-centre bubbles on bubble behaviour and stresses on the vessel were investigated. The fluid shear and circumferential stresses acting on the vessel varied with time and location. As the frequency changed, the microbubble oscillated with the highest amplitude at its resonance frequency which was different from the resonance frequency of an unbound bubble. The bubble resonance frequency increased as the rigidity of a flexible vessel increased. The fluid shear and circumferential stresses peaked at frequencies above the bubble's resonance frequency. The more rigid the vessels were, the more damped the bubble oscillations. The synergistic effect of acoustic frequency and vessel elasticity had also been investigated since the circumferential stress showed either an increasing trend or a decreasing one versus the vessel rigidity at different acoustic frequencies. When the acoustic pressure was increased from 52 to 680 kPa, the maximum bubble radius increase by 2.5 fold, and the maximum shear and circumferential stress increased by 15.7 and 18.3 fold, respectively. The shear stress was largest when the acoustic frequency was higher (3.25 MHz) and the ratio of the vessel radius to the bubble radius was lower. The circumferential stress was largest when the bubble wall was closer to the vessel wall. An oscillating off-centre bubble forms a mushroom shape with the most damping on the points closest to the vessel wall.


Figures

Figure 1
Figure 1
Aschematic illustration of the 3 dimensional geometry of bubble, blood and microvessel which was used for the numerical simulation. This is in a cylindrical coordinate where θ is in the vessel circumferential direction (r (radial), θ (azimuthal), z (axial)). (a) bubble in the middle of the vessel, (b) an off-center microbubble, (c) side view of an off-center bubble.
Figure 2
Figure 2
Viscoelastic model of a generalized Maxwell equation, where E is the Young’s modulus and η is the vessel viscosity.
Figure 3
Figure 3
Comparison between the FEM simulation on an unbound bubble and the solution of Rayleigh-Plesset equation. Pa = 2.5 P0, f = 1 MHz, R0 = 2 μm.
Figure 4
Figure 4
Validation of Experimental Data (a) Validation with optical tweezer experiment (Garbin et al 2007a). The dotted line shows the Rayleigh-Plesset solution of an unbound bubble. Solid line is the experimental result of the bubble oscillation close to a wall (Garbin et al 2007a) and solid line with dot represents the bubble radius from numerical simulation of this model. Pa = 200 kPa, f = 2.25 MHz, R0 = 2.45 μm. (b) Validation with a bubble inside a 200 μm capillary vessel. The dotted line shows the experimental result of a bubble oscillation inside a vessel (van der Meer et al 2007) and solid line the bubble radius from our numerical simulation. Pa = 58 kPa, f = 2.5 MHz, R0 = 1.7 μm.
Figure 5
Figure 5
Radial variation of the bubble wall and vessel wall versus time for 7 μs. E = 5MPa, Pa = 2.5 P0, f = 1 MHz, rv = 5 μm, R0 = 2 μm. The solid line shows bubble radius oscillation and the dashed line represents the vessel wall movement above the bubble.
Figure 6
Figure 6
Wave propagation along the vessel wall. Radial expansion of the vessel wall versus normalized axial direction (z) from the middle of the vessel to its end, showing a wave traveling inside an elastic vessel at different snapshots in time, E = 5 MPa, Pa = 2.5 P0, f = 1 MHz, R0 = 2 μm and rv = 5 μm. The axial direction is normalized to length of the vessel (L=102 μm).
Figure 7
Figure 7
Streamlines and stagnation points of (a) a rigid vessel, (b) an elastic vessel at time 4 μs. E = 5MPa, Pa = 2.5 P0, f = 1 MHz, rv = 5 μm, R0 = 2 μm.
Figure 8
Figure 8
Temporal and spatial variation of stresses (a) Fluid shear stress at point z = 2.4 μm, r = rv, (b) The shear stress versus normalized axial direction, (c) Circumferential stress versus time at point z = 0, r = rv , (d) Circumferential stress versus normalized axial direction. E = 5 MPa, Pa = 2.5 P0, f=1 MHz, rv = 5 μm, R0 = 2 μm.
Figure 9
Figure 9
(a) Maximum bubble expansion as a function of acoustic frequency of a bubble inside different vessels. Pa = 2.5 P0, rv = 5 μm, R0 = 2 μm. (b) Maximum bubble oscillation normalized to the initial bubble size versus the initial bubble size inside a rigid vessel.
Figure 10
Figure 10
Fluid shear stress versus acoustic frequency for elastic and viscoelastic vessels. Pa = 2.5 P0, rv = 5 μm, R0 = 2 μm.
Figure 11
Figure 11
Circumferential stress versus acoustic frequency for elastic and viscoelastic vessels. Pa = 2.5 P0, rv = 5 μm, R0 = 2 μm.
Figure 12
Figure 12
Maximum bubble expansion (a) maximum shear (b) and circumferential stress (c) versus acoustic pressure. E = 5MPa, f = 3.25 MHz, rv = 5 μm, R0 = 2 μm.
Figure 13
Figure 13
Maximum bubble expansion (a) vessel wall movement (b) maximum shear (c) and circumferential stress (d) versus initial bubble radius. E = 5 MPa, Pa = 2.5 P0, rv = 5 μm.
Figure 14
Figure 14
Maximum bubble expansion (a) vessel wall movement (b) maximum shear (c) and circumferential stress (d) versus initial vessel radius. E = 5MPa, Pa = 2.5 P0, r0 = 2 μm.
Figure 15
Figure 15
Maximum shear stress versus the vessel radius normalized by the initial bubble radius. E = 5MPa, Pa = 2.5 P0.
Figure 16
Figure 16
Oscillation of a bubble 2.5 μm away from the vessel center versus time for different points on the bubble wall, (a) at 1 MHz, (b) at 3.25 MHz, E = 5MPa, Pa = 2.5 P0, r0 = 2 μm.
Figure 17
Figure 17
Maximum shear (a) and circumferential stress (b) versus the azimuthal angle for a bubble 2.5 μm away from the vessel center. E = 5MPa, Pa = 2.5 P0, r0 = 2 μm. The blue line with open circle shows f=1 MHz, and the red line with asterisks represents f = 3.25 MHz.

References

    1. Bao S, Thrall BD, Gies RA, Miller DL. In vivo transfection of melanoma cells by lithotripter shock waves. Cancer Research. 1998;58:219–221. - PubMed
    1. Becher H, Burns PN. Handbook of contrast echocardiography : left ventrical function and myocardial perfusion. Springer Verlag; 2000.
    1. Brujan EA, Nahen K, Schmidt P, Vogel A. Dynamics of laser-induced cavitation bubbles near an elastic boundary. J Fluid Mech. 2001;433:251–281.
    1. Caskey CF, Kruse DE, Dayton PA, Kitano TK, Ferrara KW. Microbubble oscillation in tubes with diameters of 12, 25, and 195 microns. Appl Phys Lett. 2006;88:033902.
    1. Chen H, Kreider W, Brayman AA, Bailey MR, Matula TJ. Blood Vessel Deformations on Microsecond Time Scales by Ultrasonic Cavitation. Physical Review Letters. 2011a;106:034301. - PMC - PubMed

Publication types