

Bistability in feedback circuits as a byproduct of evolution of evolvability
- PMID: 22252387
- PMCID: PMC3296359
- DOI: 10.1038/msb.2011.98
Bistability in feedback circuits as a byproduct of evolution of evolvability
Abstract
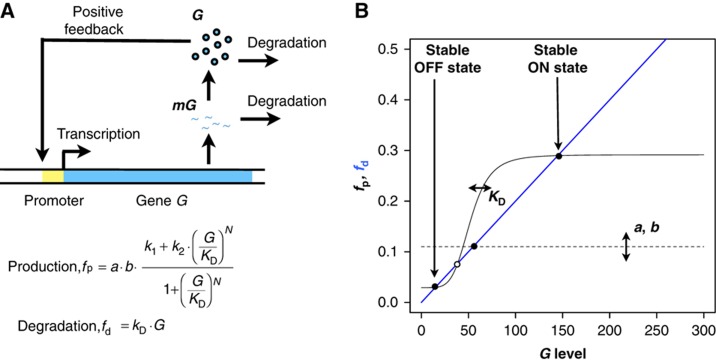
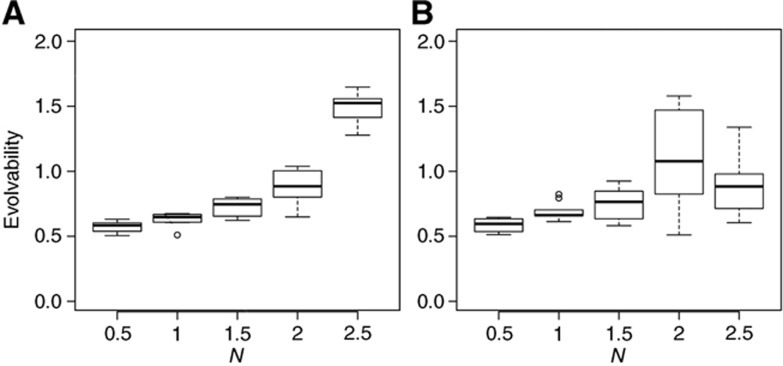
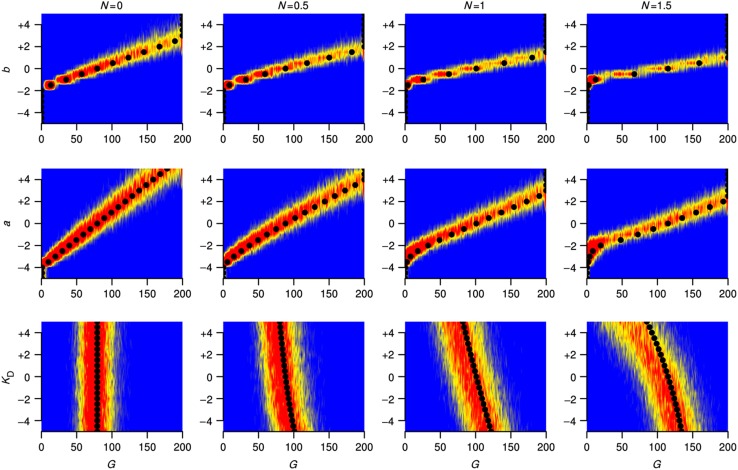
Noisy bistable dynamics in gene regulation can underlie stochastic switching and is demonstrated to be beneficial under fluctuating environments. It is not known, however, if fluctuating selection alone can result in bistable dynamics. Using a stochastic model of simple feedback networks, we apply fluctuating selection on gene expression and run in silico evolutionary simulations. We find that independent of the specific nature of the environment-fitness relationship, the main outcome of fluctuating selection is the evolution of increased evolvability in the network; system parameters evolve toward a nonlinear regime where phenotypic diversity is increased and small changes in genotype cause large changes in expression level. In the presence of noise, the evolution of increased nonlinearity results in the emergence and maintenance of bistability. Our results provide the first direct evidence that bistability and stochastic switching in a gene regulatory network can emerge as a mechanism to cope with fluctuating environments. They strongly suggest that such emergence occurs as a byproduct of evolution of evolvability and exploitation of noise by evolution.
Conflict of interest statement
The authors declare that they have no conflict of interest.
Figures
Similar articles
-
Epigenetic feedback regulation accelerates adaptation and evolution.PLoS One. 2013 May 8;8(5):e61251. doi: 10.1371/journal.pone.0061251. Print 2013. PLoS One. 2013. PMID: 23667436 Free PMC article.
-
Evolution of evolvability in gene regulatory networks.PLoS Comput Biol. 2008 Jul 11;4(7):e1000112. doi: 10.1371/journal.pcbi.1000112. PLoS Comput Biol. 2008. PMID: 18617989 Free PMC article.
-
Nonlinear Dynamics in Gene Regulation Promote Robustness and Evolvability of Gene Expression Levels.PLoS One. 2016 Apr 15;11(4):e0153295. doi: 10.1371/journal.pone.0153295. eCollection 2016. PLoS One. 2016. PMID: 27082741 Free PMC article.
-
The molecular origins of evolutionary innovations.Trends Genet. 2011 Oct;27(10):397-410. doi: 10.1016/j.tig.2011.06.002. Epub 2011 Aug 27. Trends Genet. 2011. PMID: 21872964 Review.
-
The concept of fitness in fluctuating environments.Trends Ecol Evol. 2015 May;30(5):273-81. doi: 10.1016/j.tree.2015.03.007. Epub 2015 Apr 3. Trends Ecol Evol. 2015. PMID: 25843273 Review.
Cited by
-
Noise induced oscillations and coherence resonance in a generic model of the nonisothermal chemical oscillator.Sci Rep. 2013;3:2404. doi: 10.1038/srep02404. Sci Rep. 2013. PMID: 23929212 Free PMC article.
-
Epigenetic switching as a strategy for quick adaptation while attenuating biochemical noise.PLoS Comput Biol. 2019 Oct 28;15(10):e1007364. doi: 10.1371/journal.pcbi.1007364. eCollection 2019 Oct. PLoS Comput Biol. 2019. PMID: 31658246 Free PMC article.
-
Toxin-antitoxin genes of the Gram-positive pathogen Streptococcus pneumoniae: so few and yet so many.Microbiol Mol Biol Rev. 2012 Dec;76(4):773-91. doi: 10.1128/MMBR.00030-12. Microbiol Mol Biol Rev. 2012. PMID: 23204366 Free PMC article. Review.
-
Emergent expression of fitness-conferring genes by phenotypic selection.PNAS Nexus. 2022 Jun 10;1(3):pgac069. doi: 10.1093/pnasnexus/pgac069. eCollection 2022 Jul. PNAS Nexus. 2022. PMID: 36741458 Free PMC article.
-
Critical-like Brain Dynamics in a Continuum from Second- to First-Order Phase Transition.J Neurosci. 2023 Nov 8;43(45):7642-7656. doi: 10.1523/JNEUROSCI.1889-22.2023. Epub 2023 Oct 10. J Neurosci. 2023. PMID: 37816599 Free PMC article.
References
-
- Acar M, Becskei A, van Oudenaarden A (2005) Enhancement of cellular memory by reducing stochastic transitions. Nature 435: 228–232 - PubMed
-
- Acar M, Mettetal JT, van Oudenaarden A (2008) Stochastic switching as a survival strategy in fluctuating environments. Nat Genet 40: 471–475 - PubMed
-
- Aharoni A, Gaidukov L, Khersonsky O, McQ Gould S, Roodveldt C, Tawfik DS (2005) The ‘evolvability’ of promiscuous protein functions. Nat Genet 37: 73–76 - PubMed
-
- Balaban NQ, Merrin J, Chait R, Kowalik L, Leibler S (2004) Bacterial persistence as a phenotypic switch. Science 305: 1622. - PubMed
Publication types
MeSH terms
LinkOut - more resources
Full Text Sources
Other Literature Sources
