Review
. 2012 Jan 17:8:565.
doi: 10.1038/msb.2011.99.

Differential network biology

Affiliations
Review

Differential network biology

Trey Ideker et al. Mol Syst Biol. .

Abstract

Protein and genetic interaction maps can reveal the overall physical and functional landscape of a biological system. To date, these interaction maps have typically been generated under a single condition, even though biological systems undergo differential change that is dependent on environment, tissue type, disease state, development or speciation. Several recent interaction mapping studies have demonstrated the power of differential analysis for elucidating fundamental biological responses, revealing that the architecture of an interactome can be massively re-wired during a cellular or adaptive response. Here, we review the technological developments and experimental designs that have enabled differential network mapping at very large scales and highlight biological insight that has been derived from this type of analysis. We argue that differential network mapping, which allows for the interrogation of previously unexplored interaction spaces, will become a standard mode of network analysis in the future, just as differential gene expression and protein phosphorylation studies are already pervasive in genomic and proteomic analysis.


Conflict of interest statement

The authors declare that they have no conflict of interest.

Figures

Figure 1
Figure 1
A historical timeline of differential approaches in biology. The top half of the timeline (green) tracks approaches used for differential analysis of molecular profiles over the past 20 years; the bottom half (yellow) tracks parallel approaches for differential analysis of molecular networks that have emerged more recently, within the past decade.
Figure 2
Figure 2
Differential physical interaction mapping with AP-SRM. Dynamic protein interaction network involving GRB2. Red-shaded nodes represent proteins that are recruited to GRB2 complexes after EGF stimulation irrespective of time, green-shaded nodes those that are decreased and blue-shaded nodes those present in GRB2 complexes in nonstimulated (control) cells. The thickness of the node border is proportional to the intensity of the change compared with control levels. Rectangles inside the nodes show the relative fold change for each time point. Reproduced from Bisson et al (2011).
Figure 3
Figure 3
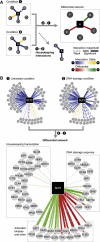
Differential genetic interaction mapping with dE-MAP. (A) Schematic showing principle of differential genetic interaction analysis. Static genetic interaction maps are measured in each of two conditions (left) resulting in both positive (yellow) and negative (blue) interactions. Condition 1 is subtracted from condition 2 to create a differential interaction map (right), in which the significant differential interactions are those that increase (green) or decrease (red) in score after the shift in conditions. In the differential map, weak but dynamic interactions (dotted edges) are magnified and persistent ‘housekeeping’ interactions are removed (bottom right). Note that (A, E) and (A, C) are decreasing differential interactions achieved by different circumstances: (A, E) is a positive interaction that disappears after the conditional shift, while (A, C) is a negative interaction that appears after the conditional shift. (B) Differential analysis for yeast gene SLT2. Genetic interaction data from Bandyopadhyay et al (2010) collected in either untreated or DNA-damage-treated conditions (top) are compared to create a differential interaction map (bottom). Interactions with transcriptional machinery are present in both conditions and thus downgraded in the differential map, while interactions with kinases and DNA damage response genes are highlighted. Functional annotations in the differential network summarize the predominant function within the demarcated set of genes.

References

    1. Aebersold R, Mann M (2003) Mass spectrometry-based proteomics. Nature 422: 198–207 - PubMed
    1. Andersen CL, Jensen JL, Orntoft TF (2004) Normalization of real-time quantitative reverse transcription-PCR data: a model-based variance estimation approach to identify genes suited for normalization, applied to bladder and colon cancer data sets. Cancer Res 64: 5245–5250 - PubMed
    1. Aranda B, Achuthan P, Alam-Faruque Y, Armean I, Bridge A, Derow C, Feuermann M, Ghanbarian AT, Kerrien S, Khadake J, Kerssemakers J, Leroy C, Menden M, Michaut M, Montecchi-Palazzi L, Neuhauser SN, Orchard S, Perreau V, Roechert B, van Eijk K et al. (2010) The IntAct molecular interaction database in 2010. Nucleic Acids Res 38: D525–D531 - PMC - PubMed
    1. Bader GD, Hogue CW (2003) An automated method for finding molecular complexes in large protein interaction networks. BMC Bioinformatics 4: 2. - PMC - PubMed
    1. Bakal C, Linding R, Llense F, Heffern E, Martin-Blanco E, Pawson T, Perrimon N (2008) Phosphorylation networks regulating JNK activity in diverse genetic backgrounds. Science 322: 453–456 - PMC - PubMed

Publication types