Comparative Study
. 2012 Jan 17:8:566.
doi: 10.1038/msb.2011.97.

Widespread translational control contributes to the regulation of Arabidopsis photomorphogenesis

Affiliations
Comparative Study

Widespread translational control contributes to the regulation of Arabidopsis photomorphogenesis

Ming-Jung Liu et al. Mol Syst Biol. .

Abstract

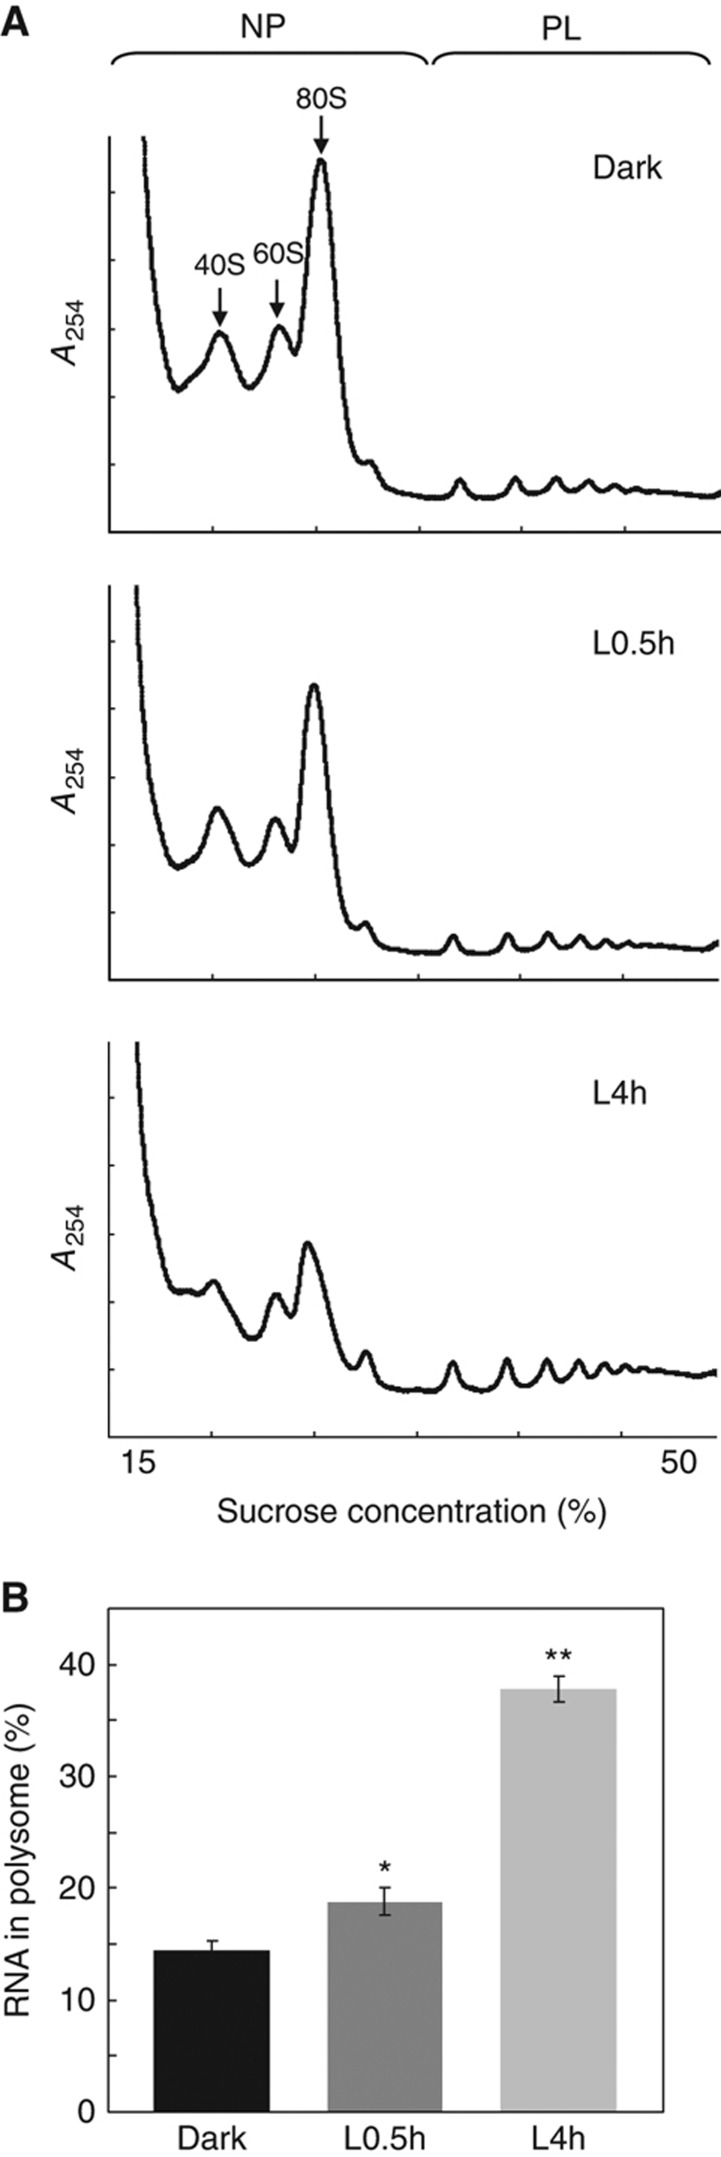
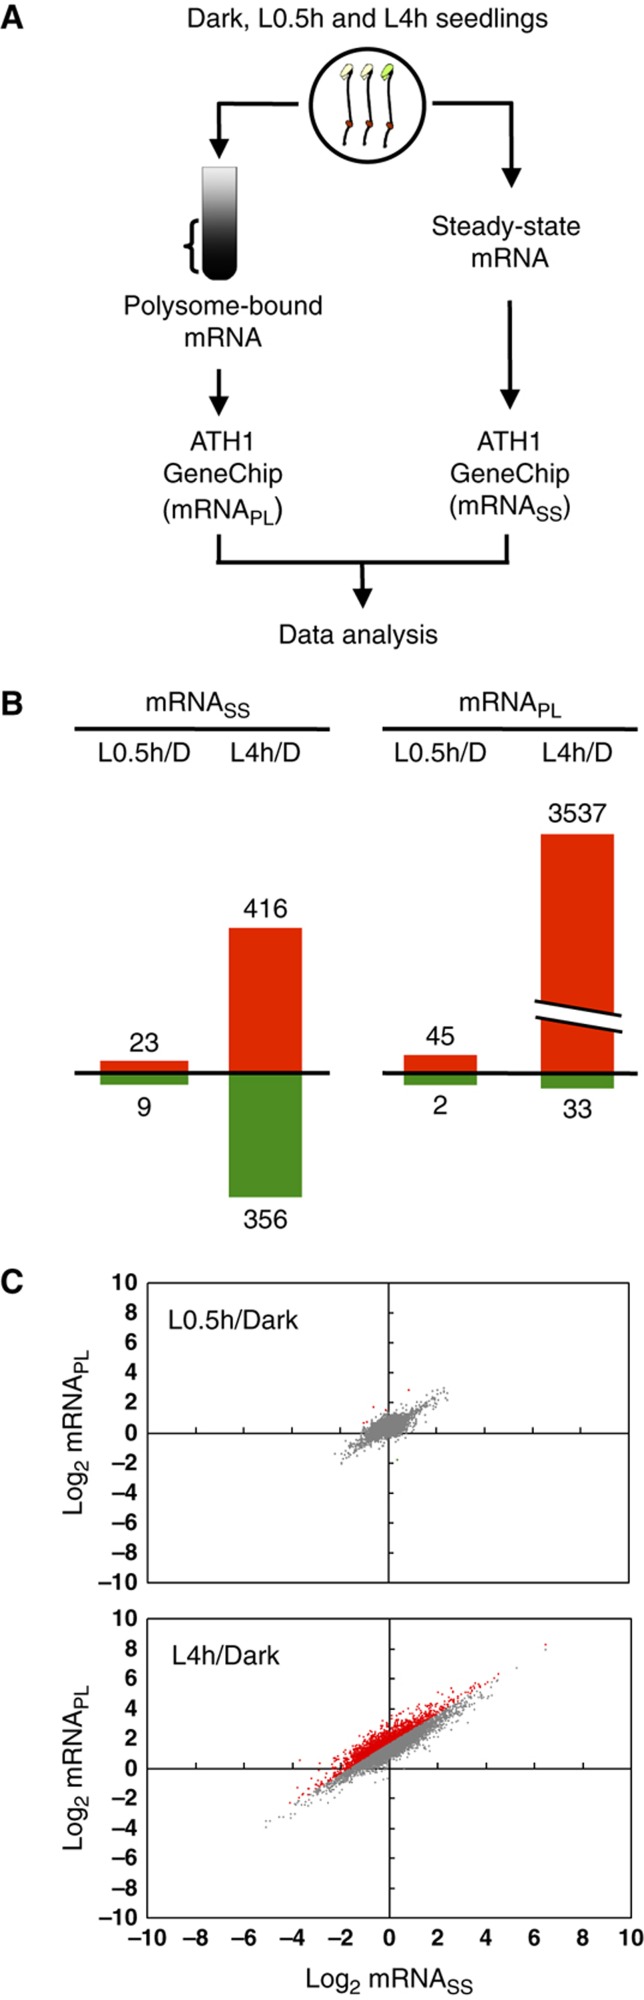
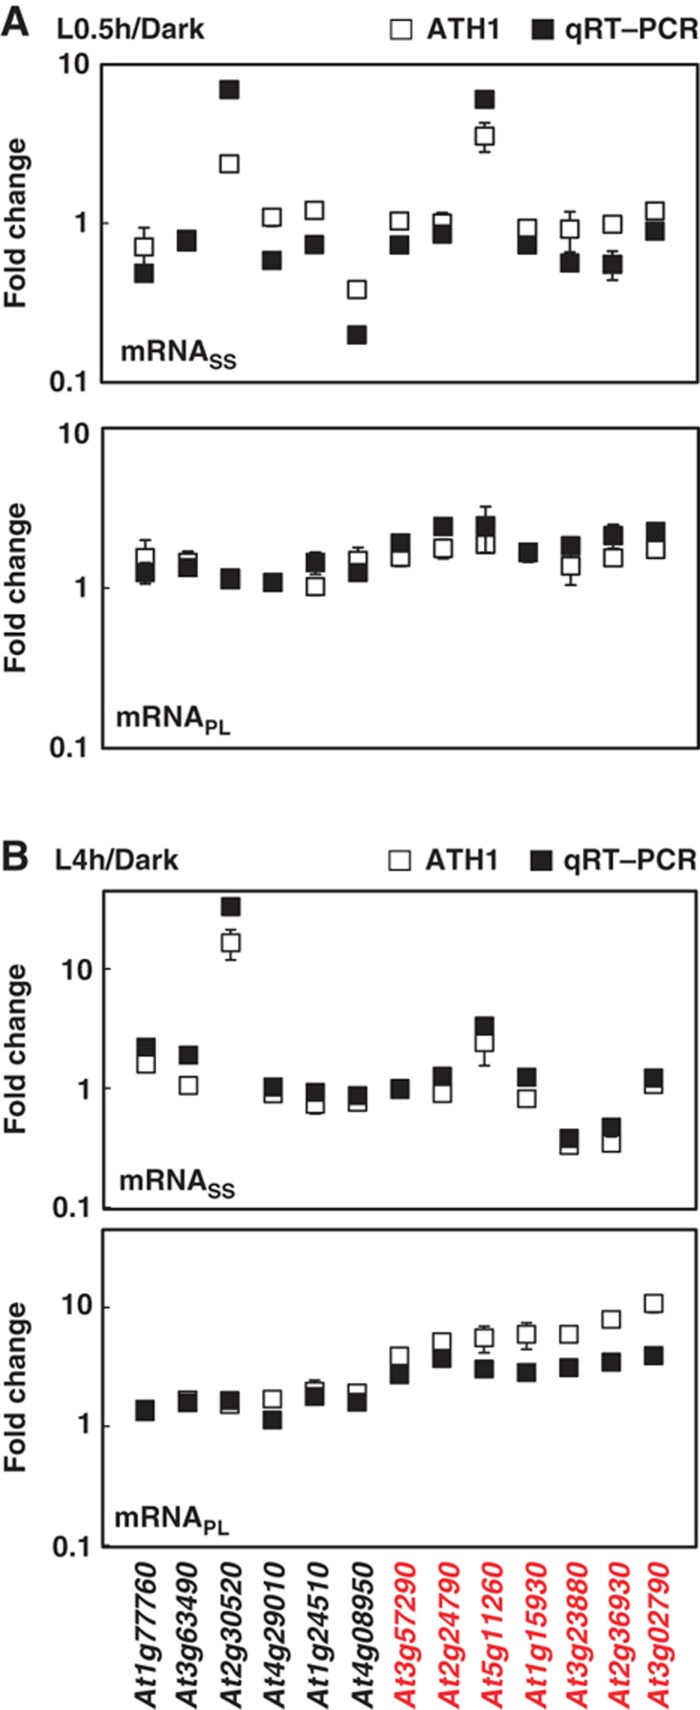
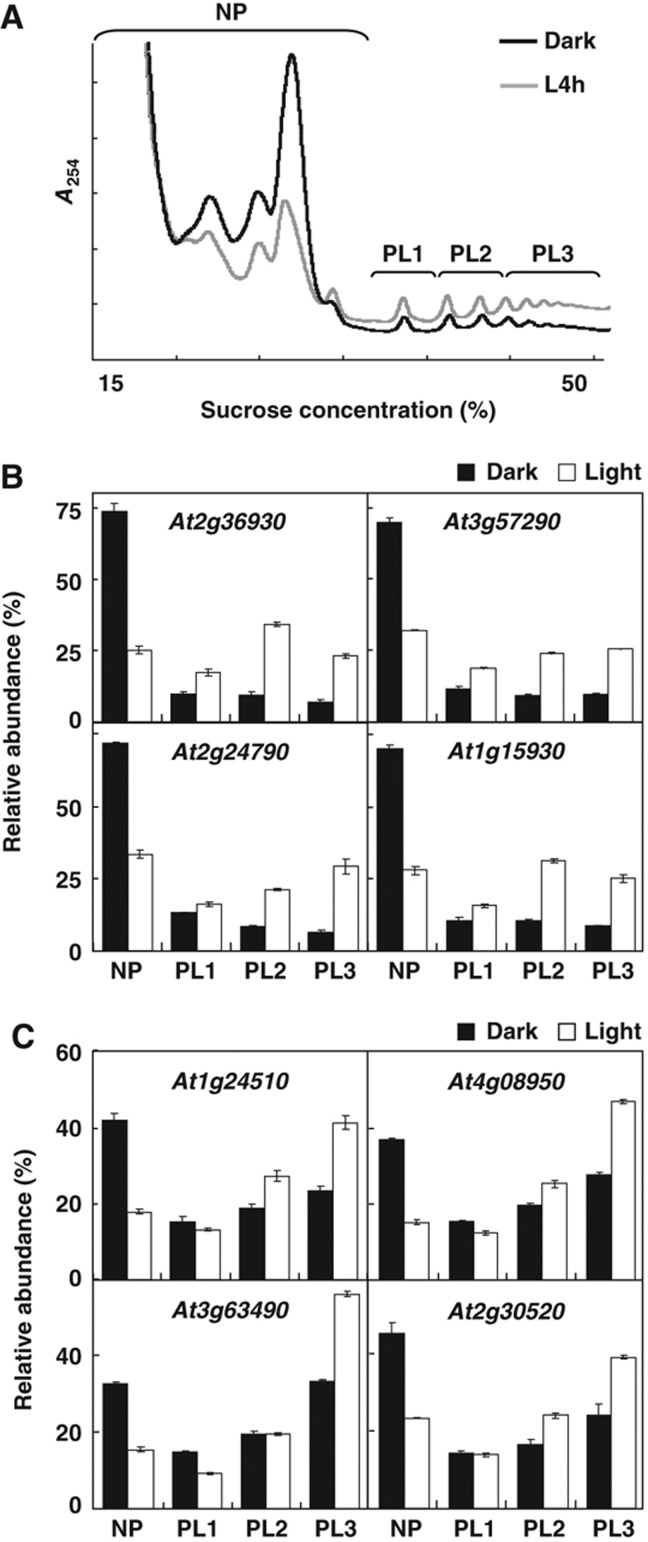
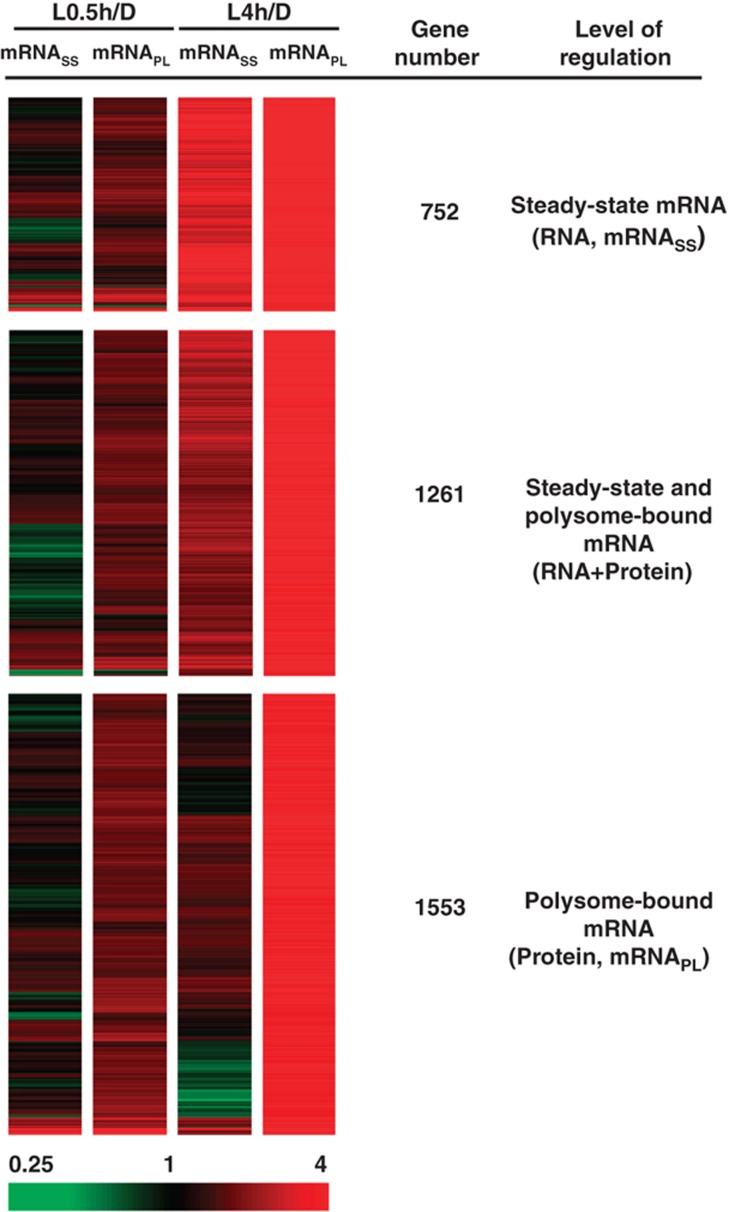
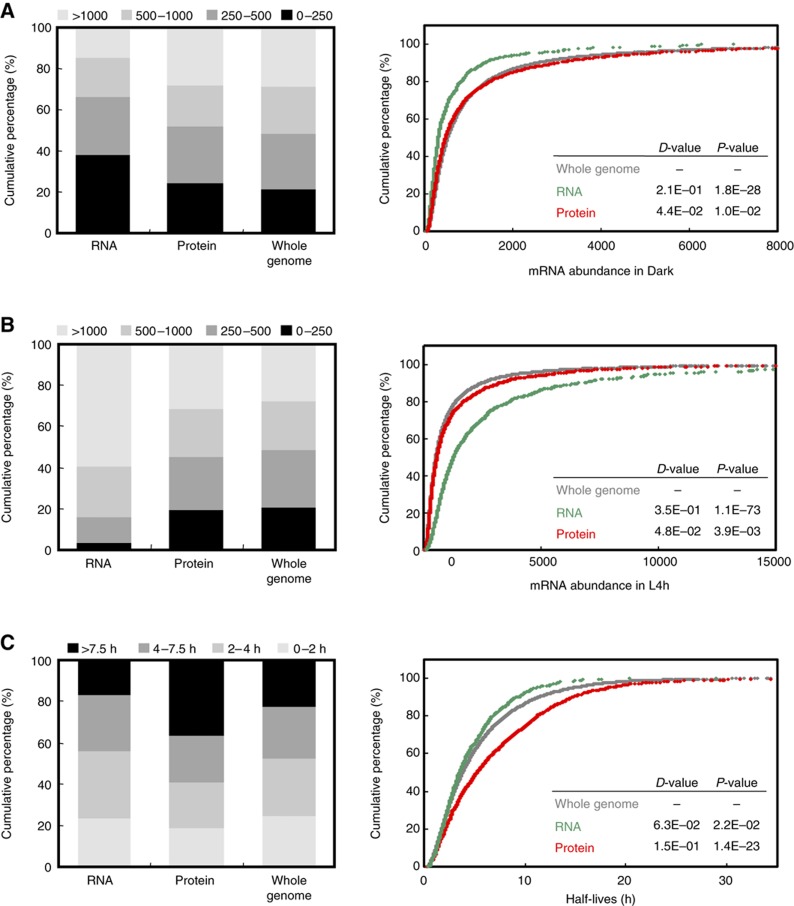
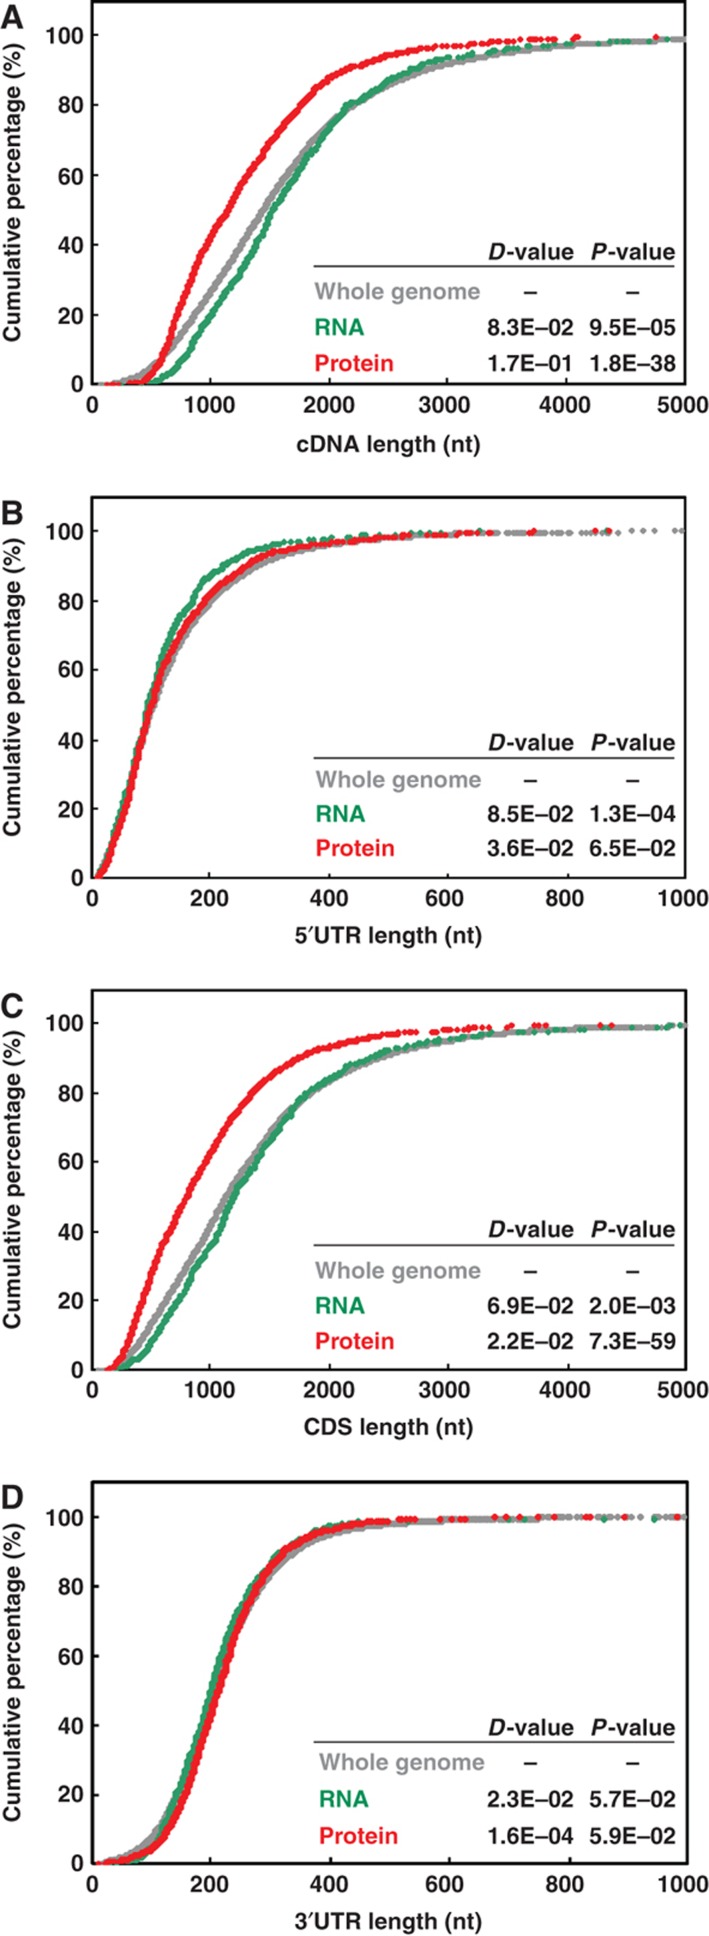
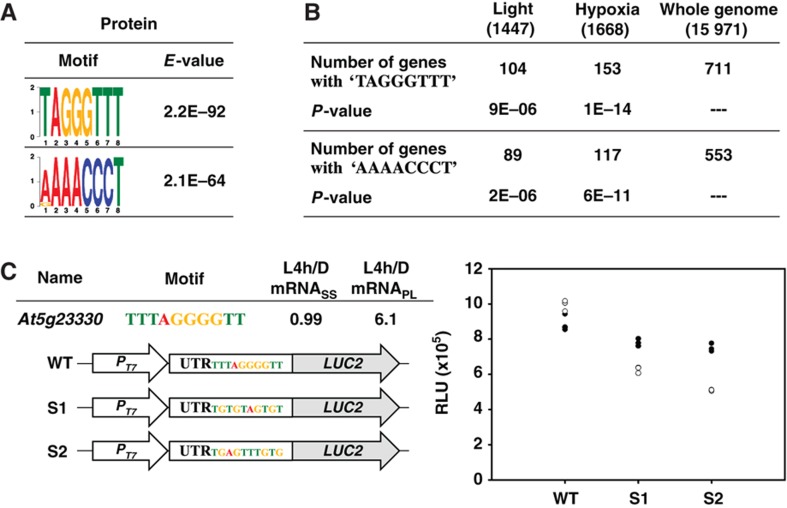
Environmental 'light' has a vital role in regulating plant growth and development. Transcriptomic profiling has been widely used to examine how light regulates mRNA levels on a genome-wide scale, but the global role of translational regulation in the response to light is unknown. Through a transcriptomic comparison of steady-state and polysome-bound mRNAs, we reveal a clear impact of translational control on thousands of genes, in addition to transcriptomic changes, during photomorphogenesis. Genes encoding ribosomal protein are preferentially regulated at the translational level, which possibly contributes to the enhanced translation efficiency. We also reveal that mRNAs regulated at the translational level share characteristics of longer half-lives and shorter cDNA length, and that transcripts with a cis-element, TAGGGTTT, in their 5' untranslated region have higher translatability. We report a previously neglected aspect of gene expression regulation during Arabidopsis photomorphogenesis. The identities and molecular signatures associated with mRNAs regulated at the translational level also offer new directions for mechanistic studies of light-triggered translational enhancement in Arabidopsis.


Conflict of interest statement

The authors declare that they have no conflict of interest.

Figures

Figure 1
Figure 1
Light enhances the global translational efficiency in Arabidopsis. (A) Polysome profiles of Arabidopsis seedlings grown in the dark or treated with white light for 0.5 h (L0.5h) or 4 h (L4h). Ribosome subunits (40S and 60S), mono-ribosome (80S), NP and PL fractions are marked. (B) Bar graph shows the ribosome loading efficiency in seedlings grown in the Dark, L0.5h and L4h. Values are mean percentages±s.e. from three biological replicates. *P<0.05 and **P<0.0001, Student's t-test. A254, absorbance at 254 nm.
Figure 2
Figure 2
A comparison of light-induced changes in steady-state and polysome-bound mRNAs. (A) An illustration of the experimental design. Total and polysome-bound RNAs were isolated in parallel for hybridization to Affymetrix ATH1 GeneChips for transcriptomic profiling analyses. (B) The number of genes with ⩾three-fold changes at mRNASS or mRNAPL levels. Red and green colors represent genes upregulated and downregulated, respectively, by light treatment. (C) A genome-wide comparison of the gene expression at mRNASS and mRNAPL ratios between Dark- and L0.5h- or between Dark- and L4h-treated samples. The log2 values of the fold changes are plotted for the defined expressed genes (n=11 598). Red dots represent genes with ⩾three-fold differences between mRNASS and mRNAPL ratios.
Figure 3
Figure 3
Confirmation of increased ribosome occupancy by qRT–PCR. Changes in steady-state and polysome-bound mRNA abundance between Dark and L0.5h (A) or between Dark and L4h (B) samples (filled square) with standard deviations were calculated from three technical repeats of one representative biological repeat. Results for an independent biological repeat were shown in Supplementary Figure S3. Transcriptome data obtained from ATH1 hybridization were also plotted (open square), with error bars calculated from three biological repeats. Red color represents genes under translational control. At1g77760, nitrate reductase 1 (NIA1); At3g63490, ribosomal protein L1p/L10e family; At2g30520, root phototropism 2 (RPT2); At4g29010, abnormal inflorescence meristem (AIM1); At1g24510, TCP-1/cpn60 chaperonin family protein; At4g08950, phosphate-responsive 1 family protein; At3g57290, eukaryotic translation initiation factor 3E (eIF3e); At2g24790, constans-like 3 (COL3); At5g11260, elongated hypocotyl 5 (HY5); At1g15930, ribosomal protein S12e (RPS12e); At3g23880, F-box family protein; At2g36930, zinc finger (C2H2 type) family protein; At3g02790, zinc finger (C2H2 type) family protein. Source data is available for this figure in the Supplementary Information.
Figure 4
Figure 4
Light triggers an increase in ribosome density. (A) An illustration showing NP, and PL subfractions, PL1, PL2 and PL3, corresponding to the polysome profiles of the Dark and L4h seedlings. (B, C) qRT–PCR analysis of relative mRNA abundance (%) of selected genes in each fraction. The filled and open bars represent expression data from Dark and L4h samples, respectively. Error bars represent the standard deviation calculated from three technical repeats of one representative biological repeat. Results for two independent biological repeats were shown in Supplementary Figure S4. Source data is available for this figure in the Supplementary Information.
Figure 5
Figure 5
Categorization of light-responsive genes regulated at mRNA or protein levels. The 3566 light-upregulated genes (with ⩾ three-fold changes at mRNASS or mRNAPL levels) were categorized into three groups, preferentially regulated at the steady-state mRNA level (RNA), the polysome-bound mRNA level (Protein) or both (RNA+Protein). Extreme red and green colors indicate four-fold upregulation and downregulation, respectively.
Figure 6
Figure 6
Light activates translation of transcripts with longer half-lives. Genes in each defined regulatory group were partitioned according to their mRNA abundances in Dark (A), L4h (B) samples and mRNA half-lives (C) and expressed as relative percentages (left panel). The bin size was arbitrarily determined so that the percentage of each category for the whole genome data set was about 25%. The cumulative curves (right panel) show the distribution of mRNA abundances and half-lives for genes in each group. The D-values of the K–S test represent the difference in distribution between the ‘Whole genome’ (gray) and ‘RNA’ (green) or ‘Whole genome’ and ‘Protein’ (red) groups. P-values are also calculated to determine statistically significant differences.
Figure 7
Figure 7
Light activates translation of transcripts with shorter CDS length. The cumulative curves were plotted for genes in ‘Whole genome’, ‘RNA’ or ‘Protein’ groups according to mRNA features: (A) cDNA length, (B) 5′ UTR length, (C) CDS length and (D) 3′ UTR length. The statistical difference was measured by the K–S test as described in Figure 6.
Figure 8
Figure 8
Cis-elements contributing to selective translation. (A) Distinct motifs overrepresented in the ‘Protein’ group are shown as the sequence LOGO. (B) Occurrences of ‘TAGGGTTT’ and ‘AAAACCCT’ elements in the 5′ UTR of the translationally regulated mRNAs under light or hypoxia treatments. P-values were determined by two-tailed Fisher's exact test. (C) mRNASS and mRNAPL ratios of At5g23330 obtained from ATH1 hybridization in this study are shown. Sequences and constructs illustrated were used for evaluating the translatability of LUC2 transcript harboring ‘TAGGGGTT’ element (WT) or sequences of scrambled cis-elements (S1 and S2) in its 5′ UTR region. T7 promoter (PT7) was used for in-vitro transcription. The LUC2 activity was expressed as relative luminescence unit (RLU) in an in-vitro transcription and translation assay as described in Materials and methods. Three technical repeats for each of the two biological repeats are plotted (marked as filled and open circles). Source data is available for this figure in the Supplementary Information.
Figure 9
Figure 9
Experimental validation of light-responsive transcription factors regulated at transcriptional and translational levels. ATH1 expression data for BBX22 (A) and HY5 (B) at mRNASS and mRNAPL levels in Dark, L0.5h and L4h samples are plotted as fold change, with the Dark sample arbitrarily set to 1 (upper panel). Immunoblotting was used to detect BBX22 and HY5 proteins at different times. Endogenous α-tubulin (TUB) was used as a loading control (lower panel). Source data is available for this figure in the Supplementary Information.

Similar articles

Cited by

References

    1. Agresti A (1992) A survey of exact inference for contingency tables. Stat Sci 7: 131–177
    1. Alexa A, Rahnenfuhrer J, Lengauer T (2006) Improved scoring of functional groups from gene expression data by decorrelating GO graph structure. Bioinformatics 22: 1600–1607 - PubMed
    1. Arava Y, Wang Y, Storey JD, Liu CL, Brown PO, Herschlag D (2003) Genome-wide analysis of mRNA translation profiles in Saccharomyces cerevisiae. Proc Natl Acad Sci USA 100: 3889–3894 - PMC - PubMed
    1. Bailey TL, Elkan C (1994) Fitting a mixture model by expectation maximization to discover motifs in biopolymers. Proc Int Conf Intell Syst Mol Biol 2: 28–36 - PubMed
    1. Bailey-Serres J, Sorenson R, Juntawong P (2009) Getting the message across: cytoplasmic ribonucleoprotein complexes. Trends Plant Sci 14: 443–453 - PubMed

Publication types

MeSH terms